Weekly – We started this report for the past five weeks, pointing out that high-frequency data was relatively firm and did not support high near-term recession odds. That continued last week with caveats.
The good news, the CPI data, Atlanta Fed wage growth tracker (unsmoothed), and solid NY Fed weekly economic index (WEI) increased the soft landing odds. Odds of a soft landing, defined as the Fed easing without a growth accident occurring, have risen because inflation has fallen.
The bad news, direct measures of labor market tightness suggest employment growth has meaningfully overshot. The unemployment rate has fallen to its lowest level since 1969. That means the Fed needs to deliver a sustained period of below-trend demand growth to drive unemployment higher and reduce inflation pressures from the labor market. With the Fed forced to maintain slow growth, recession risk will remain elevated relative to the historical base rate. And with economic growth slowing, recession risk is probably a bit closer. Gerard used to characterize recession as applying mostly beyond six months. Three months is probably more accurate now.
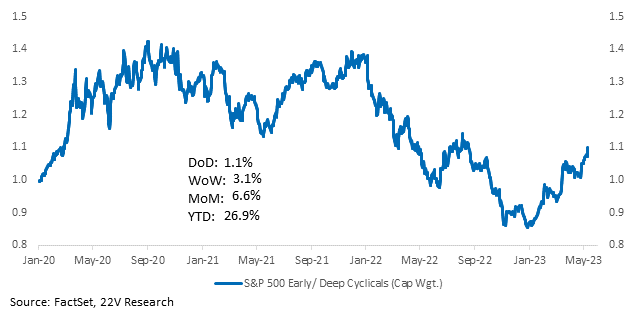
Given how strong the labor market is relative to demand growth, It seems evident the labor market will loosen more aggressively over the next few months. That doesn’t guarantee a recession, but many will assume that weakening employment means we are on a path toward bad economic outcomes. That should anchor inflation expectations and interest rates, continuing to favor Early Cyclicals (Tech, Discretionary, and Communications) relative to Deep Cyclcials (Energy, Industrials, Materials). FYI…mega caps tend to outperform smaller caps (not small, just smaller) when the 10yr falls or stalls. Pricing power will continue outperforming “over earners” (stock list below).
It is critical that high-frequency demand measures (NY Fed weekly econ index, claims, retail sales, TSA crossing etc.,) don’t come under significant pressure. If they do, recession risk will increase.
China’s credit, inflation, and import reports all came in below expectations. The implied deleveraging of Chinese households and the lack of offsetting stimulus from the Chinese government, which Michael Hirson thinks is unlikely, should remain a headwind for inflation expectations. Weak Chinese economic growth trends favor Early Cyclicals as well. Defensive stocks will maintain a bid if US labor markets are slowing and China’s economic headwinds remain.
Two things that would lead to Deep Cyclicals reversing. 1) A near-term recession is becoming much more apparent, leading investors to sell this year’s winners. Then Early Cyclicals get sold as the entire market goes down. Near-term recession risk would spike if consumption decelerated quickly and “labor hoarding” unwound. 2) It becomes clear a 5% Fed funds is not restrictive enough. After all, we had similar savings rates, which supported spending, in 2006 with similar interest rates. So, the labor market doesn’t cool enough, and with housing data already bottoming, PMIs would stabilize, given the inventory unwind in 1Q23 (HERE).
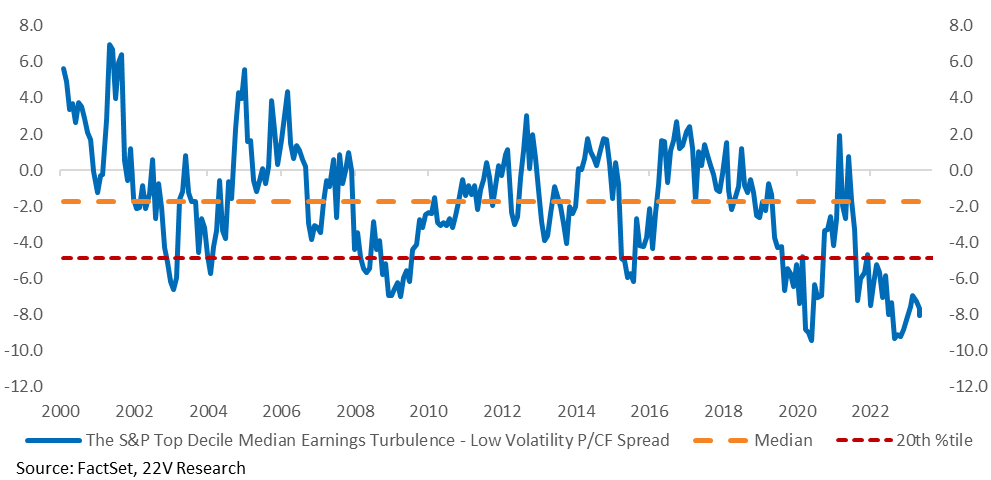
We held a call with macro specialist Angel Ubide last week (HERE), and he laid out the no-landing case that would support Deeper Cyclicals. Angel’s scenario resembles Jason Furman’s “continued overheat,” which is his modal case (HERE); +3% inflation with a relatively low unemployment rate (urate would rise but not much). Earnings growth would be significantly better than expected under that backdrop, led by stronger topline. With Earnings Turbulence fundamentals at historic lows on a price-to-sales and price-to-cash flow basis relative to Low Vol stocks, a significant reversion higher would happen. Energy and Discretionary would benefit the most at the expense of Utilities and Staples.
We thought some mean reversion in Earnings Turbulence would happen last week, but that was wrong. If we get through the next 3-months of labor market loosening without a significant economic problem, and the no-landing scenario becomes obvious, expect Deep Cyclicals and Earnings Turbulence stocks to move up aggressively. Maybe China looks better over the summer and in 4Q as well.
On The Market: Even if economic growth slows quickly and the unemployment rate moves up to ~4%, don’t expect the market to drop much. Hedging activity is elevated at the same time exposure is low. Typically that setup has been positive for forward returns. And if inflation expectations and 10yr yields remain anchored as growth slows, the percentage of S&P stocks with cash return yields above 10yr yields will remain above 60%. Earnings would still be lower YoY, but PE should not come under pressure as inflation slows and cash return yields stay high.
Charts and text below…
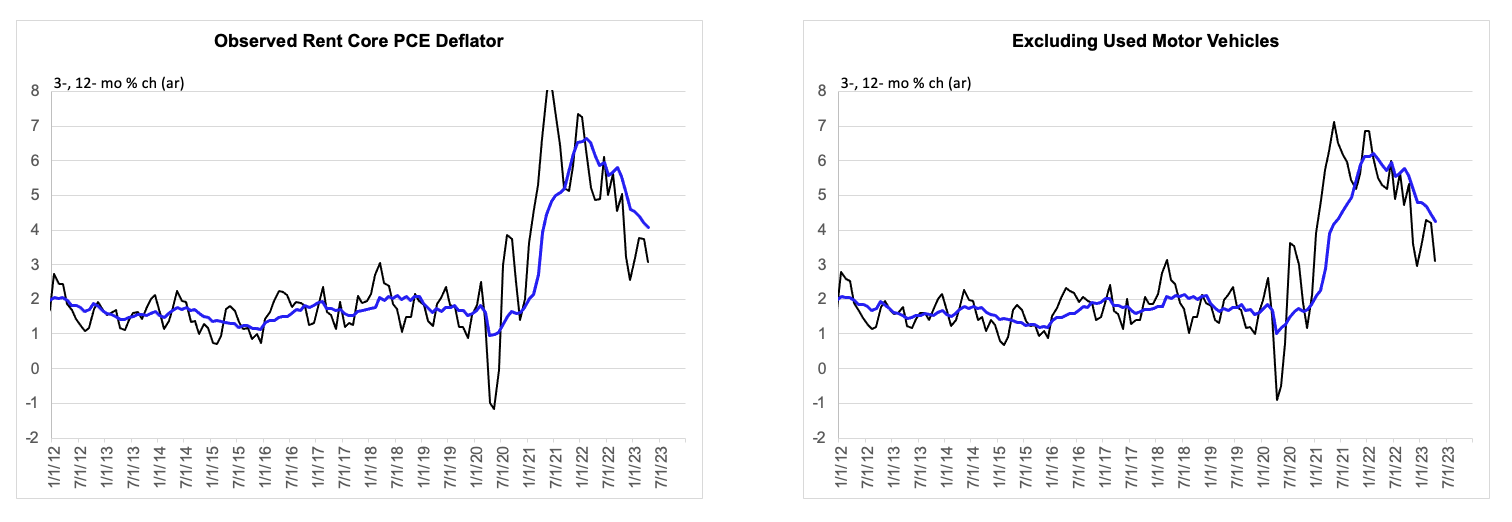
Indicators & Other Charts: From Gerard, “The single best measure of super-core goods and services price inflation may be what I call the Observed Rent Core PCE Deflator – Ex Used MV. The central tendency measures, such as the median and trimmed mean. are not of much value in this environment. Based on the individual price detail in the CPI and PPI, this better measure looks to have been up about 0.2% during April and and at an annualized rate of 3% during the three months to April. So, the news on this front was constructive this month, as in recent months on balance.”
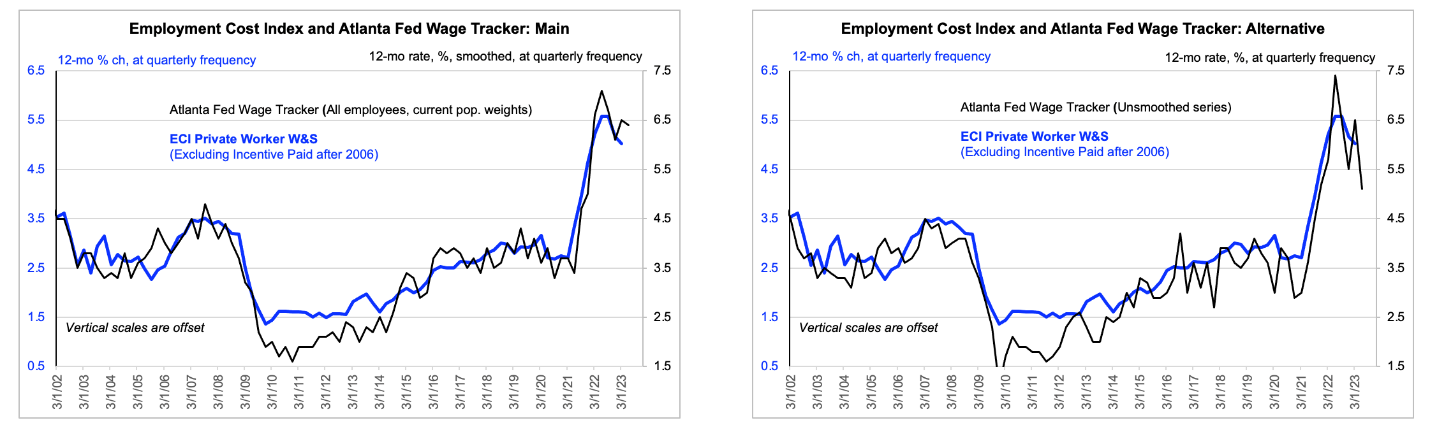
There has also been decent news in terms of wage inflation. The wage data in last week’s jobs report showed a continued moderation in average hourly earnings, after controlling for sector and rank mix shift. And the unsmoothed version of the Atlanta Fed’s Wage Tracker fell from a 12-month rate of 6.4% to just 5.1%. Given the upward bias in the Wage Tracker, due to its failure to control for typical career advance (a cost of monitoring individuals, which delivers other advantages), that 5.1% rate maps to typical wage inflation that would be 50 to 100 bps lower. Of course, that series is volatile and surveys individuals, rather than firms. Separately, the single best measure of wage inflation, the ECI, suggests are wage inflation rate of about 5%. The “truth” may be in a range of 4% to 5%.
Our central case here is qualitatively unchanged. The Fed needs to deliver a sustained period of below-trend demand growth to increase unemployment rate to reduce inflation pressures in the labor market. While the Fed maintains that stance, recession risk will remain elevated relative to the historical base rate.
China Headwinds Remain: Both China’s credit and inflation reports were below expectations. The big miss was on credit – new aggregate financing was RMB 1,220 bn, compared to a consensus of RMB 2,000 bn and a March figure of RMB 5,380 bn. The main area of weakness was household loans, which have fallen to a record low. Households are in deleveraging mode. Michael Hirson, 22V’s head of China research, thinks this increases the odds of a PBoC rate cut, or RRR cut this quarter, but he doesn’t anticipate a broad loosening of policy near term. At some point, this will be priced in, which oil prices are showing some signs of, but hard commodities will continue to trade lower as China’s unwillingness to add stimulus becomes clear.
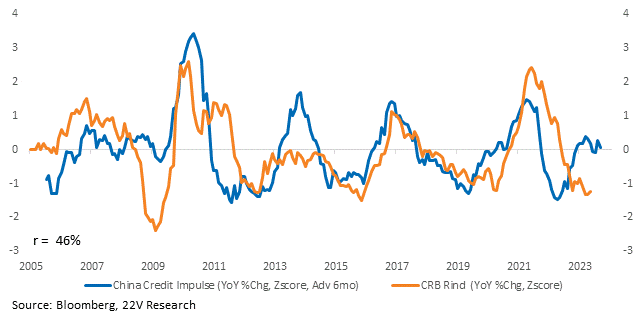
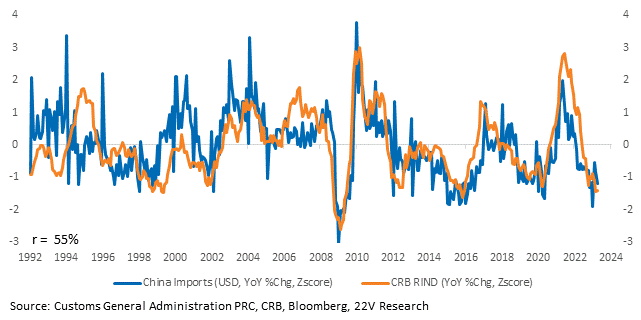
China imports missed expectations for April, falling -7.9% y/y vs -0.2% estimated. China is not generating a commodity tailwind, a theme Michael Hirson has been all over (HERE).
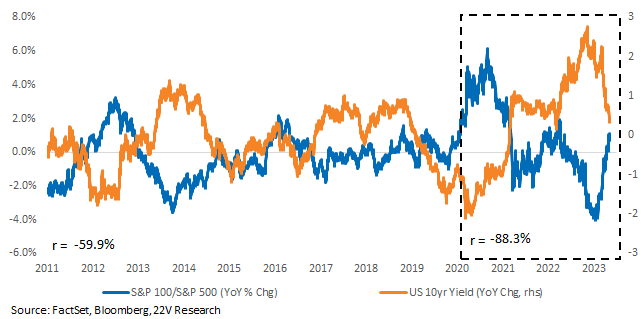
10yr Yields the Main Driver: Historically, the relative performance of the S&P 100 and the broad index have been negatively correlated with 10yr yield. In other words, mega caps outperform the broad index when the 10yr is falling or stalls. That relationship intensified in the COVID era. Further slowing of economic activity, which is the Fed’s goal, should continue to benefit larger cap stocks.
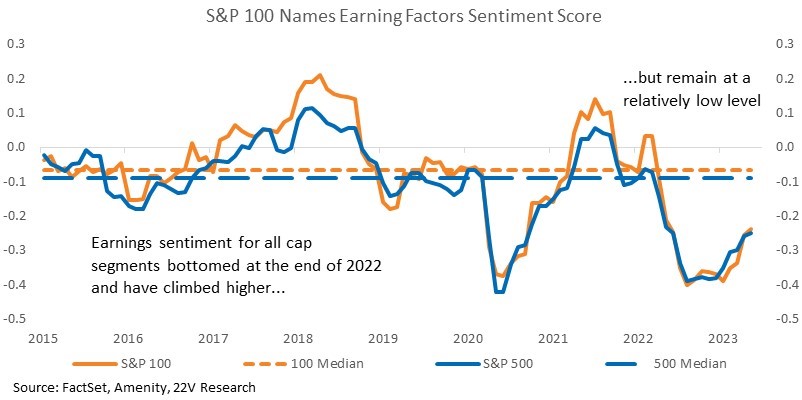
Leveraging the Amenity natural language processing tool to analyze the sentiment of corporate managers shows earnings sentiment of mega caps tends to be better than that of the broad index, but the spread is narrow. Earnings sentiment for both segments has turned higher since the end of 2022. Remember that the absolute level of earnings sentiment is still VERY low (sub-20th %tile). Earnings are still slowing. Management sentiment toward earnings bottomed in 2H22 and has been trending higher this year, and has a long way to go to reach normal levels.
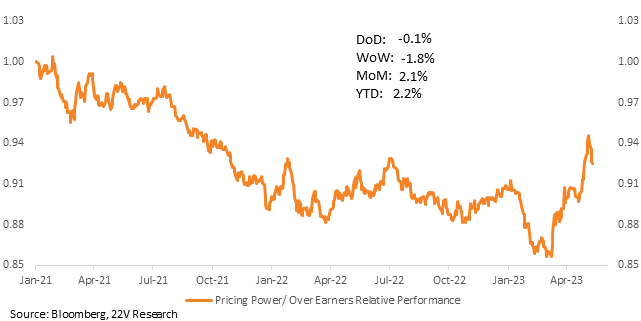
Pricing Power Over “Over Earners”: 22V’s Pricing Power portfolio is outperforming our Over Earners portfolio. Isolating companies that can maintain pricing power vs. those that can’t is a durable theme while inflation moves lower. For strong Pricing Power, we filtered the S&P for companies whose management teams expressed positive sentiment about their ability to pass through costs. For over earners, we filtered the S&P for names with unusually sharp margin and sales growth acceleration during high inflation (ex Energy), leaving them at risk while inflation drops. Constituents at the end of the report.
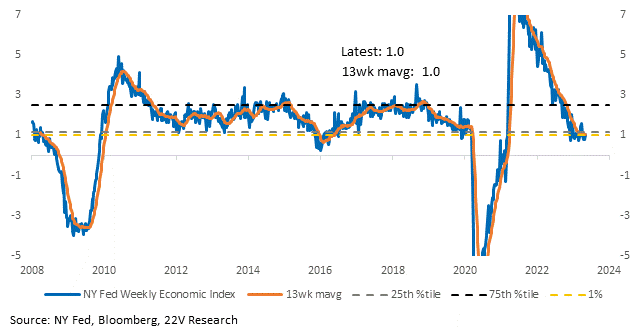
The economy appears to be growing at a slightly below-trend pace (1% underlying demand according to the NY Fed Weekly Economic index. Atlanta Fed GDPNow at 2.7% for 4Q), and labor hoarding has been a real phenomenon. That explains why the labor market has remained unusually tight despite demand slowing to a below-trend pace (from BOOM levels). Over the next few months, expect the labor market to loosen more. It WILL NOT AUTOMATICALLY mean a hard landing, and an important check on hard landing odds will be what high-frequency economic data does. If the NY Fed weekly economic index remains steady as the labor market cools, that would be consistent with a soft landing. Recent data has been consistent with a soft landing.
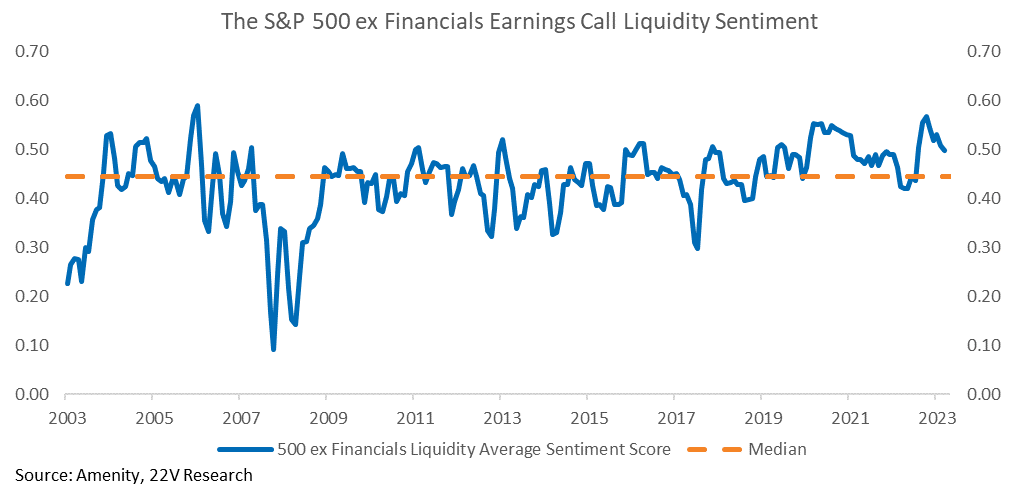
How much tighter lending is impacting demand is difficult to measure in real-time. One metric we like is Liquidity sentiment of the S&P ex-financials. Liquidity sentiment measures what management is saying (positive or negative) about the availability of cash/credit. So far, Liquidity ex-financials remains in its 83rd percentile. Company management is NOT signaling a large decline in the availability of cash/credit.
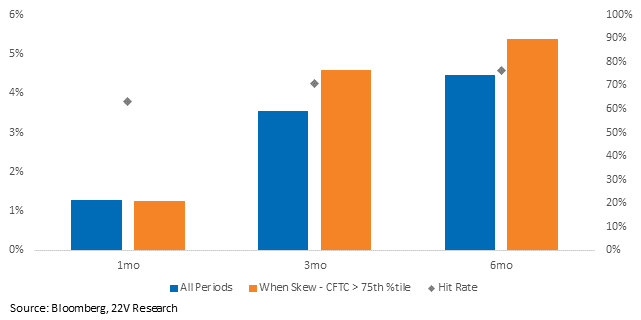
Investor Protection vs. Positioning: Investors are paying up for hedges again but doing so when actual positioning, defined by the CFTC S&P net positioning data, is unusually low. It is odd historically to have investors paying up for downside protection when CFTC positioning data is this low. Most investors we talk to agree that 4200 is the high end of the market range, and the upside is limited in the most plausible scenarios. That makes us a bit nervous about a squeeze higher in risk if negative positioning unwinds.
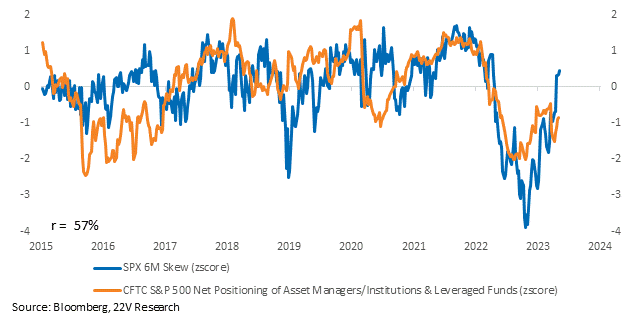
Fyi, S&P forward returns are usually better than normal when skew is this far ahead of exposure.
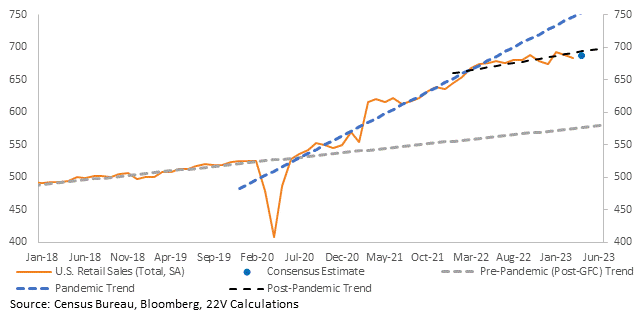
Consumer: Real Personal Consumption Expenditure growth is shifting lower. It was running at a 3% pace (very strong historically), and Gerard estimates the launch into 2Q puts us at a 1-1.5% pace. That is much lower than 3%, but in line with the post-GFC period and not close to recessionary. Below is what retail sales trends will look like if consensus is correct next week.
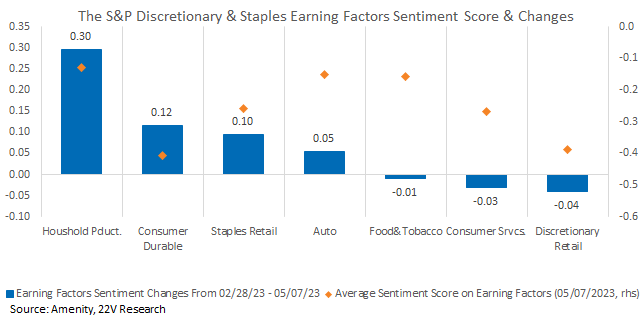
Earnings sentiment readings suggest Auto earnings will remain okay. Consumer industry group sentiment scores have improved in 1Q. Forward looking earnings sentiment for Staples is better than Discretionary with Household Products leading. Retail sentiment fell the most of any Consumer group during 1Q reporting.
HASN’T WORKED: When looking at other ratios, the trend is more consistent with factor returns. The price-to-sales spread between Earnings Turbulence and the Low vol factor is near historic lows.
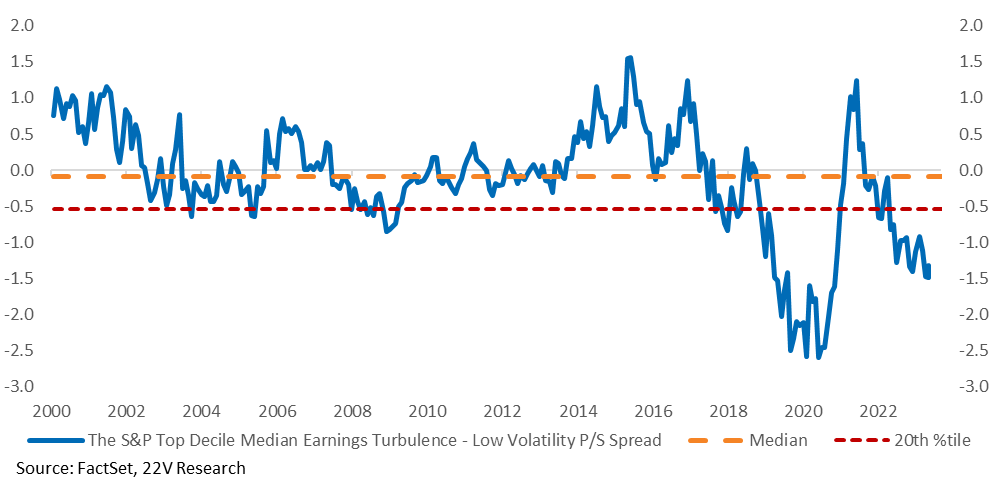
The same goes for the price-to-cash flow spread. On a cash flow basis, Earnings Turbulence stocks are unusually cheap relative to Low Volatility stocks.
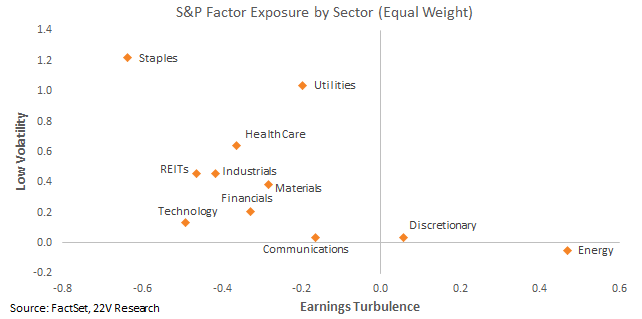
Discretionary and Energy are the sectors with the highest exposure to the Earning Turbulence Factor. Staples and Utilities have the highest exposure to the Low Vol Factor
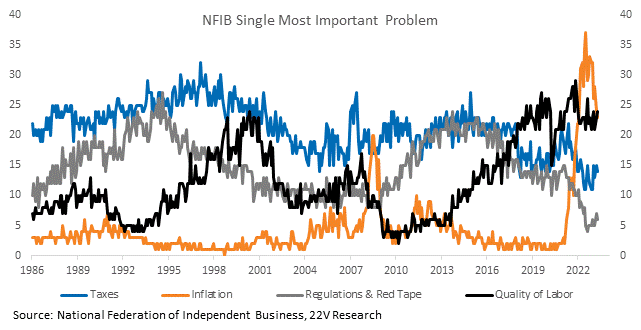
ECONOMIC INERTIA & AMPLIFICATION: We hosted a webinar with our good friend Angel Ubide, head of econ and macro at Citadel. 30-minute replay link (HERE). Two great points to highlight. 1) there is inertia in the unemployment rate. Labor hoarding will take longer to unwind than investors anticipate. Companies are afraid they can’t find replacement talent (“quality of labor” is once again the most significant concern for small businesses), so they will be reluctant to fire employees, especially since companies expect a better 2H23.
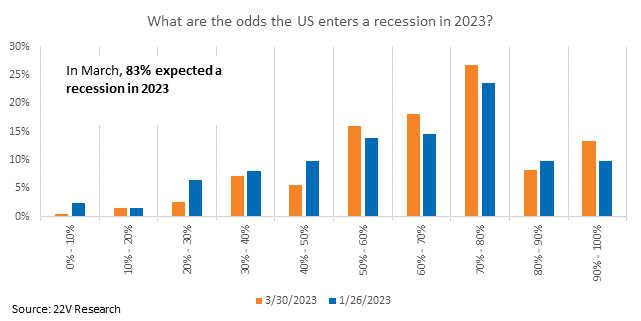
We recognize the pushback that rules like the Sahm indicator have a high historical hit rate. Yes, once the unemployment rate starts rising, it tends not to do it orderly. We aren’t pushing back against that, rather the timing of a recession. At the beginning of April, 83% of investors put the odds of a recession in 2023 above 50%. Inertia pushes recession risk farther out.
In the scenario that Angel described, we would end up with something like Jason Furman’s “continued overheat,” which is his modal case (HERE). +3% inflation with a relatively low unemployment rate. Earnings growth would be significantly better than expected under that backdrop, led by stronger topline. Financial conditions wouldn’t ease, though, and future recession risk would be elevated. Assuming the Fed thinks 3% core PCE is too high. If core PCE can get back to the 2.5-3% range, the Fed can let financial conditions ease and that would be the positive scenario for equities.
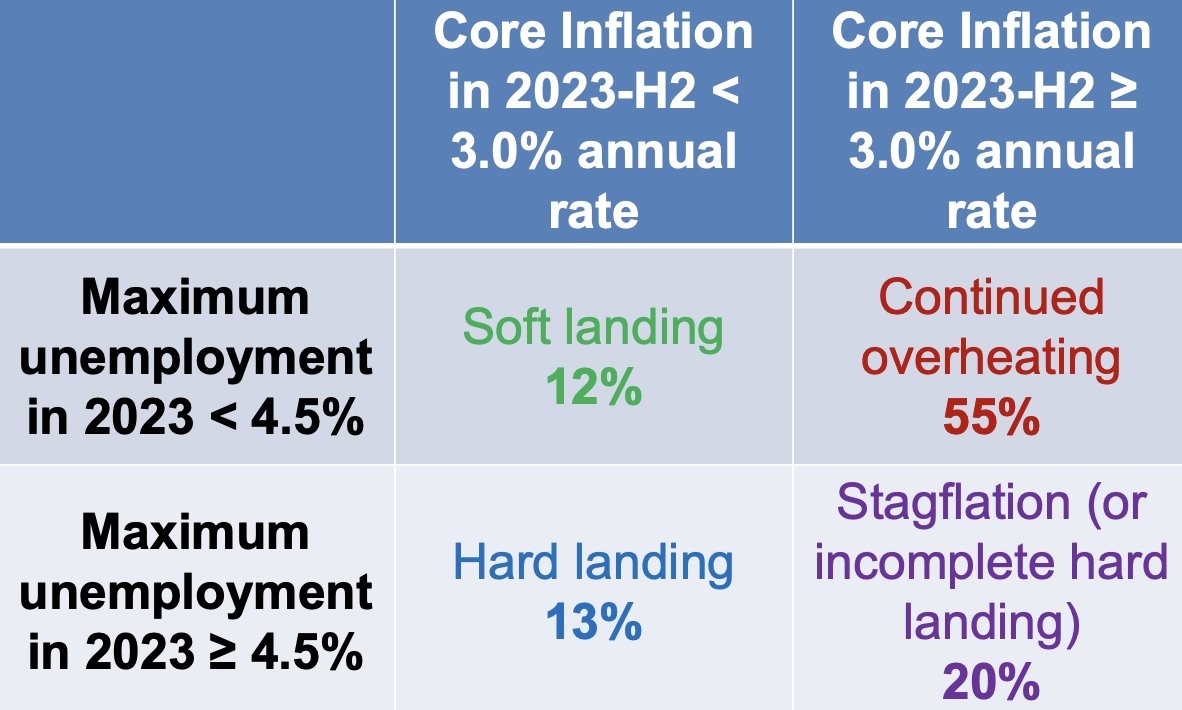
Source: Jason Furman’s Twitter, linked above
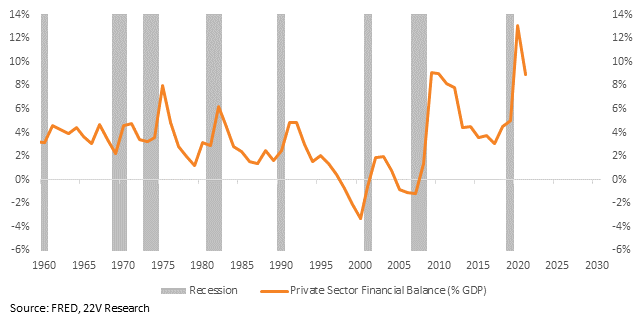
2) Angel made another big point: recessions become deep recessions when there are amplification mechanisms. In 2000, the surplus was over-investment in tech and the resulting recession didn’t even have two consecutive quarters of negative GDP growth. In 2008, housing was a different story. Right now, amplification is hard to find. There is a private sector surplus. A recession is not likely to turn into a deep recession.