SUMMARY: We cover a wide range of topics today. The general theme is there’s news flow about the debt ceiling, Fed, financial stress, and Bank liquidity sentiment that highlight risks to the market and to our lower correlations, pro-Cyclical call. BUT the breadth of data still argues for lower correlations. We still have conviction in more dispersion and stock picking. Details below…
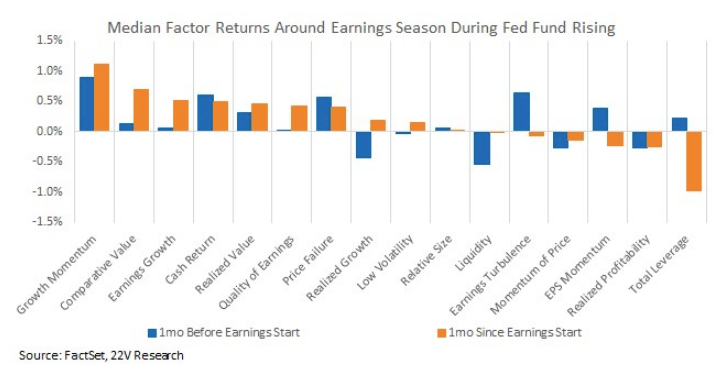
Per Kim Wallace, 22V Washington policy analyst, “Our call remains no default this year as very few elected officials have incentive to invite or allow. Yes, mistakes happen but that truism hasn’t ever applied to US default.” The immediate problem is the Fed will keep pressing. Below we show how factors perform into and during earnings reporting season DURING rate hike cycles. Momentum and Value tend to perform well.
Yesterday the Beige Book was released, and the NY Fed reported tightening lending standards. Corporate bonds are being cut to junk at the fastest pace since 2020 (HERE) too. Our aggregation of credit stress has decreased recently and the ratio of high yielding debt trading distressed is still tame. Risks are present, but systemic risk is no longer accelerating. So far, the data still argues for lower correlations.
For the most part, Banks earnings have been good so far. Nearly all Banks have beat consensus estimates. But most of the banks that have reported were the high quality ones and there is one note of caution we have picked up on through our sentiment work – Bank liquidity sentiment has dropped significantly relative to the S&P.
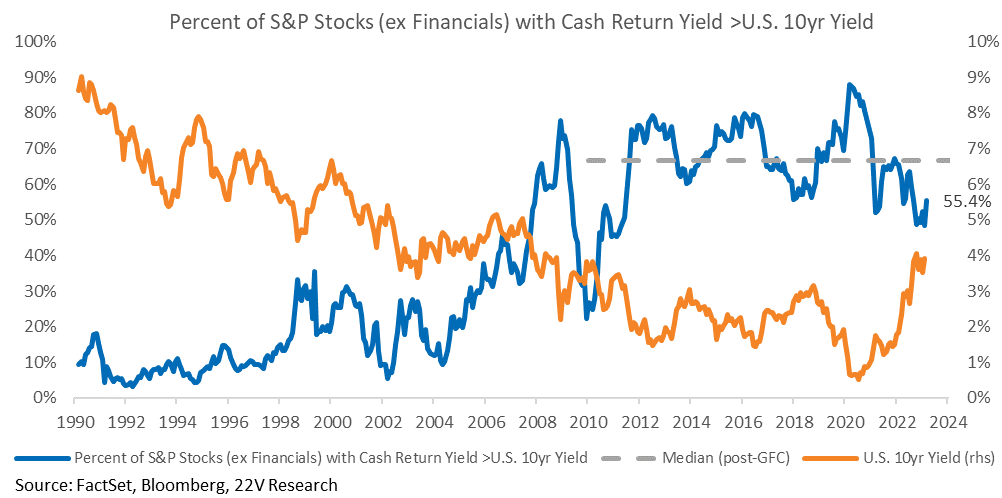
We have talked about how the cash return of the S&P is an underappreciated support to the market (here) and how buybacks are an increasingly important part of cash returns. Most large Banks have already reduced buybacks. The harm from poor liquidity sentiment to cash return is already in.
It’s important to consider the concentration of buybacks. Buybacks are not evenly distributed within the index and the largest contributors are predominantly non-bank/financial services names. The buyback sentiment of the top 25 contributors is better than overall S&P buyback sentiment. We’re not arguing buybacks won’t fall from here, but that it’s not a given the cash return of the S&P craters. This argues for a rangebound market.
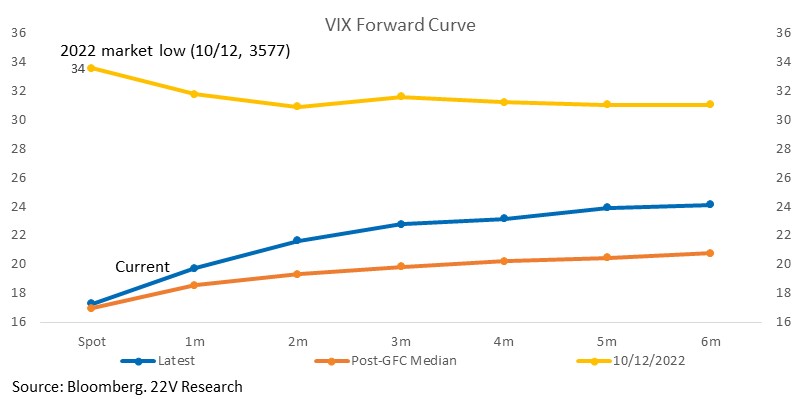
MARKET VIEWS: Earnings releases are accelerating and the VIX is back to a level last seen at the start of 2022, when the S&P PE was 3 points higher, and the index was ~15% above yesterday’s close. Macro uncertainty is high, medium-term recession risk is elevated, and a mass of potentially problematic bank earnings will be released over the next few weeks. Some near-term weakness is a risk, especially in today’s highly mean reverting backdrop, but macro data suggests credit conditions remain okay, and net positioning in equities remains deeply pessimistic. Medium-term risks are elevated, which helps explain why out month vol is elevated.
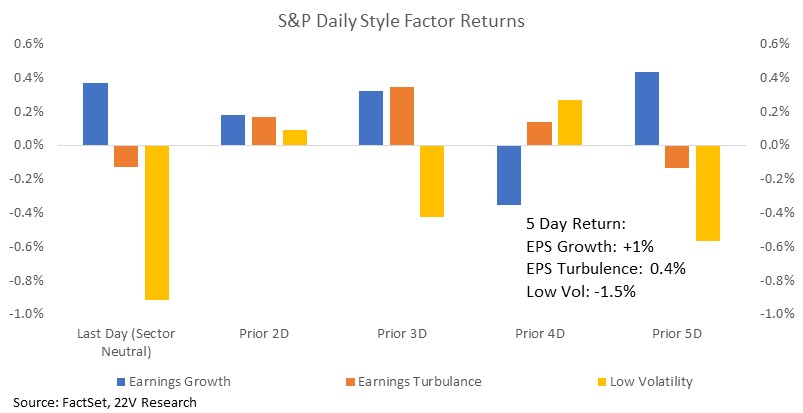
Internals have been volatile, but suggest investors are leaning risk-on into earnings season. If earnings reports are stronger than expected, which is what our sentiment data and improvements in guidance/revisions suggest, risk-on factors should lead. We continue to favor higher quality + higher sentiment names. Deeply held recession expectations and declining correlations suggest companies with weakening fundamentals will be punished more than normal. Companies with strong Earnings Growth rankings are leading internals over the past week.
DEBT CEILING: The debt ceiling negotiations poses a risk to our lower correlations, pro-Cyclical tilt. But per Kim Wallace, 22V’s Washington policy analyst, “Our call remains no default this year as very few elected officials have incentive to invite or allow. Yes, mistakes happen but that truism hasn’t ever applied to US default.” We could get some volatility spikes, as Kim also notes “More likely than not we will have to endure a few short-term extensions before a longer-term deal materializes.” However, the immediate problem is the Fed will keep pressing. Below we show how factors perform into and during earnings reporting season during rate hike cycles.
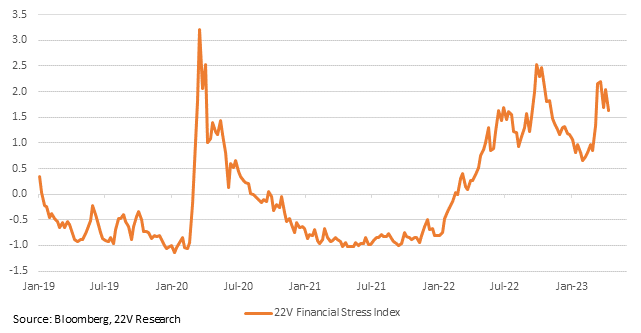
 FINANCIAL STRESS: Yesterday the Beige Book was released, and the NY Fed reported, “Regional banks continued to report widespread declines in loan demand, ongoing credit tightening, and modestly rising mortgage delinquency rates.” FYI the collection period was on or before April 10. Our aggregation of credit stress – blending the Fed balance sheet, C&I loans, cdx, and Bank cds – has decreased recently. To be clear, loan growth does present a serious risk; our point is that systemic risk is no longer accelerating. If it does, correlations are likely to move higher near-term.
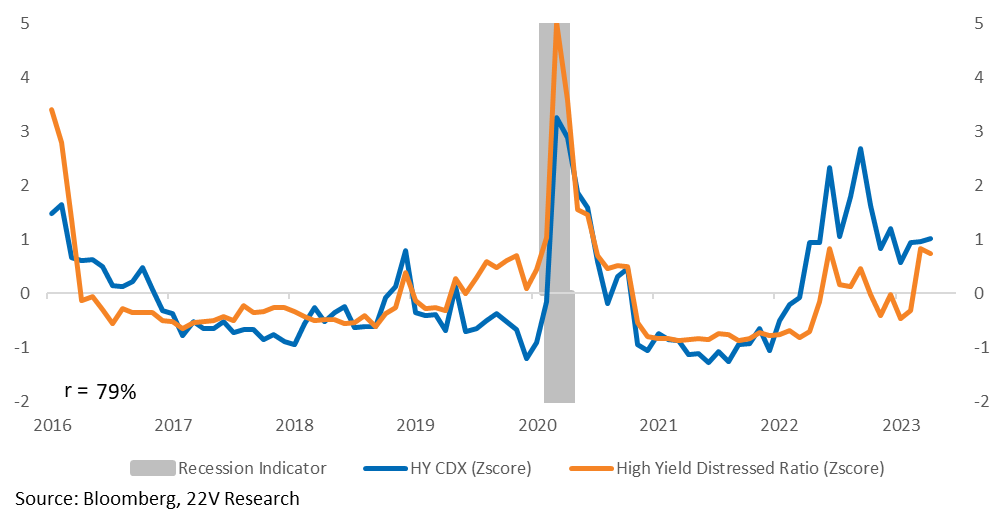
Corporate bonds are being cut to junk at the fastest pace since 2020 (HERE). The ratio of high yielding debt trading distressed is still tame though. Same story as the above – risks are present, but systemic risk isn’t accelerating. We will continue to monitor these indices. So far, the data still argues for lower correlations.
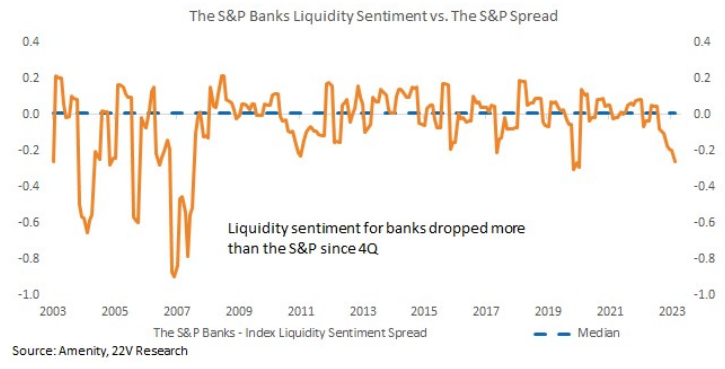
CASH RETURN: For the most part, Banks earnings have been good so far. Nearly all Banks have beat consensus estimates. But most of the banks that have reported were the high quality ones and there is one note of caution we have picked up on through our sentiment work – Bank liquidity sentiment has dropped significantly relative to the S&P. The weakening of liquidity sentiment began with rate hikes and that trend remains firmly in place.
Market Supports: We have talked about how cash return is an underappreciated support for stocks (here) and how buybacks are an increasingly important part of cash returns. Net buybacks have hooked lower and are vulnerable to earnings downturns. Slower growth should continue to restrain the breadth of buybacks.
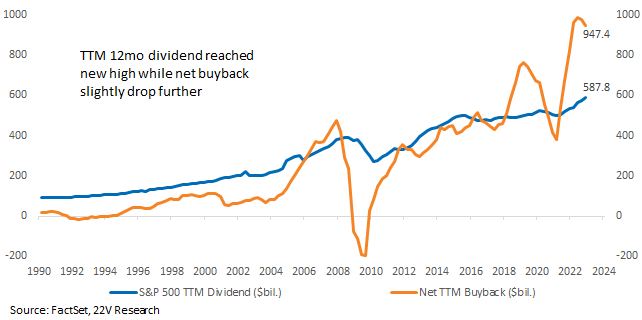
Most large Banks have already reduced buybacks. Financial services are the third largest contributor to TTM net buybacks (~9%), but Banks are a now smaller portion of net buybacks. The harm from poor liquidity sentiment to cash return is already in. This is another reason to expect correlation breakdowns within Banks.
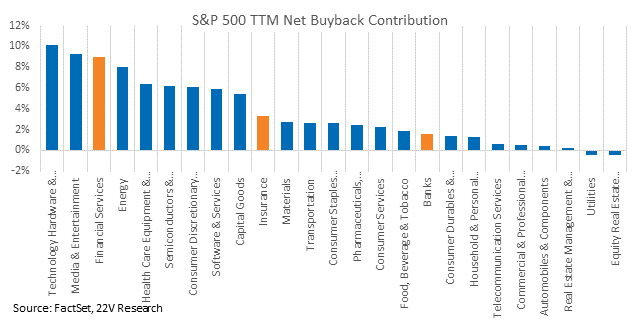
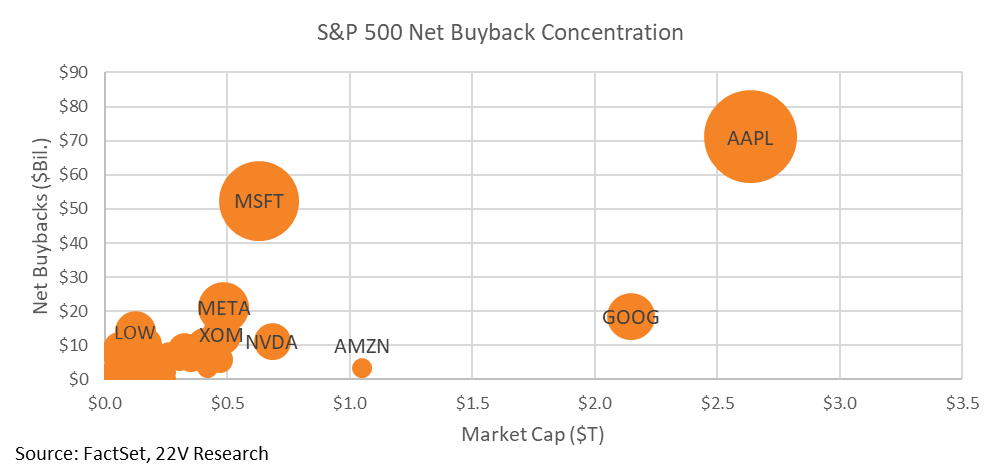
It’s important to consider the concentration of buybacks. The top 25 contributors account for 51% of ttm net buybacks (but 32% market cap). FYI JP Morgan is the only bank left in the top 25. Only 3 are financial services (V, MA, and MS). The top 10 contributors account for 36% of ttm net buybacks (22% of market cap), and none of the top 10 are banks or financial services. The point being that buybacks are not close to evenly distributed within the index and the largest contributors are predominantly non-bank/financial services names. Index level buybacks and cash return are insulated from Bank weakness.
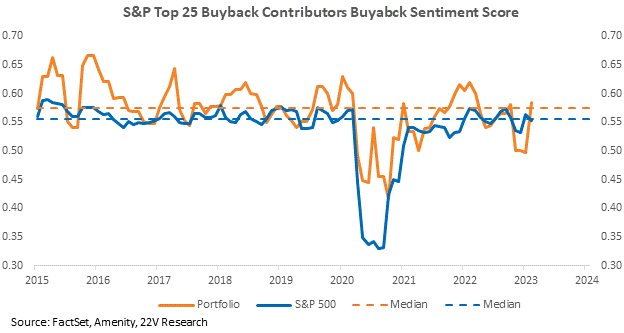
The buyback sentiment of the top 25 contributors is better than overall S&P buyback sentiment. We’re not arguing buybacks won’t fall from here, the nominal level is likely to move somewhat lower. But it is not likely S&P cash return. This argues for a rangebound market.
The percentage of stocks (ex-financials) that have a cash return yield above the 10yr yield has fallen but is still elevated. This further emphasizes the point that the index cash return is still attractive.