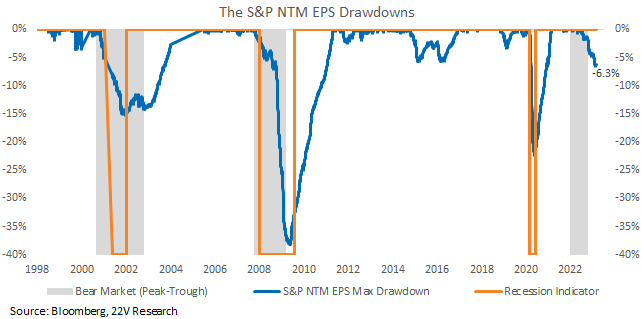
4Q earnings season, which is winding down, helped to confirm that demand remained firm through the end of 2022. Longer-term, stronger growth and more inflation means more rate hikes and higher recession risk. That is the bad news. The good news is that same strength also suggests less earnings deterioration. NTM EPS estimates have stabilized and have remained at ~$223 for the pasts three months. NTM estimates are still down -6.3% from their June 2022 peak though. Earnings HAVE weakened, just not as much as feared. Recession risk remains the major factor impacting the depth of NTM EPS drawdown.
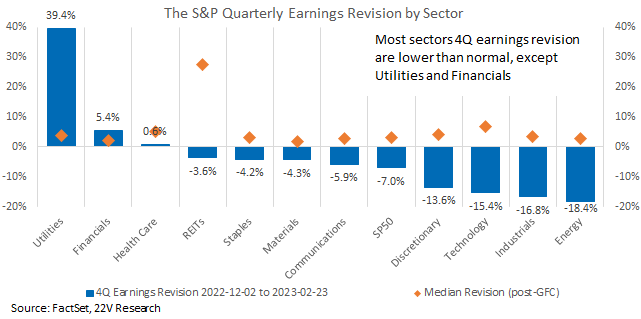
Quarterly earnings revision for 4Q has been extremely low with EPS forecasts falling -7% since the start of reporting. That makes this the second worst post-GFC earnings season, only better than the earnings season during COVID. Defensive sectors in general saw upward or smaller downward revisions, but that has not translated into returns. YTD, Early Cyclicals are leading Deep Cyclicals, and Cyclicals in general are leading Defensives. Investors are still more risk-off tilted based on our latest survey (results HERE). The combination of low expectations AND better than expected economic momentum prevented a Defensive rotation.
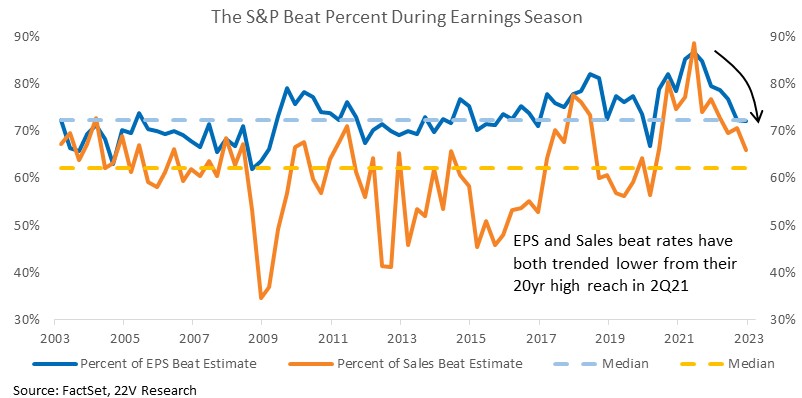
Put into an historical context, the EPS beat rate is lower than normal, falling to its 47th %tile. Sales beats were better, falling to their 64th %tile. An important point is that BOTH are still higher than what was seen during past recessions, and that is particularly true for Sales beats. Nominal growth is not collapsing even as trend growth has clearly slowed.
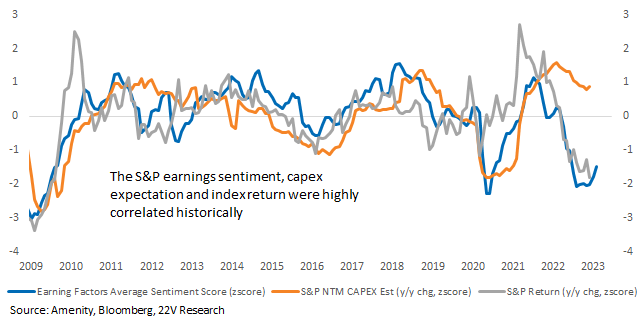
And sentiment is getting better. S&P earnings sentiment expressed by managers during conference calls, measure sentiment using the Amenity NLP tool, improved throughout earnings season. Firming of sentiment is an objective confirmation of the stronger than expected macro data, especially within the services sector. This is another reason to expect a shallower 2023 EPS drawdown than was feared a few months back. Another important point. Historically, earnings sentiment, capex expectations, and S&P returns have been highly correlated.

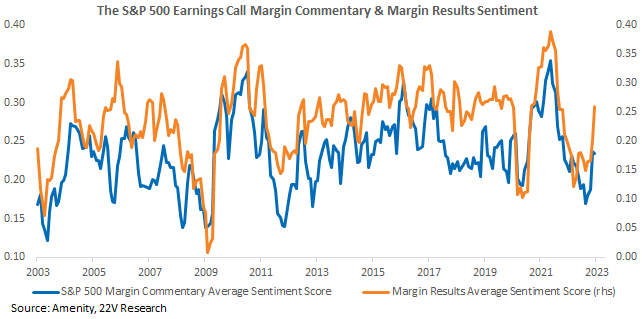
The biggest risk to earnings this year is a rapid contraction in margins. Importantly, margin sentiment has rebounded over the past quarter. Actual margins will end reporting below bbg consensus estimates from the start of reporting. Margins will remain under pressure. What sentiment readings tells us is that the degree of margin contraction should slow, and there is increasing upside risk to profitability (more on margins HERE).
4Q Earnings Slowed Less than Expected: Macro readings are volatile, but clearly suggest a trend of stronger than anticipated growth. 4Q earnings season, which is winding down, helped to confirm that demand remained firm through the end of 2022. Longer-term, stronger growth and more inflation means more rate hikes and higher recession risk. That is the bad news. The good news is that same strength also suggests less earnings deterioration. NTM EPS estimates have stabilized and have remained at ~$223 for the pasts three months. NTM estimates are still down -6.3% from their June 2022 peak though. Earnings HAVE weakened, just not as much as feared. Recession risk remains to be the major factor impacting the depth of NTM EPS drawdown.
Quarterly earnings revision for 4Q has been extremely low with EPS forecasts falling -7% since the start of reporting. That makes this the second worst post-GFC season, only better than the earnings season during COVID. Eight of the 11 GICS sectors saw earnings estimates revised lower during reporting (exceptions were Utilities, Financials and Health Care). Defensive sectors in general saw upward or smaller downward revisions. That has not translated into returns though. YTD, Early Cyclicals are leading Deep Cyclicals, and Cyclicals in general are leading Defensives.
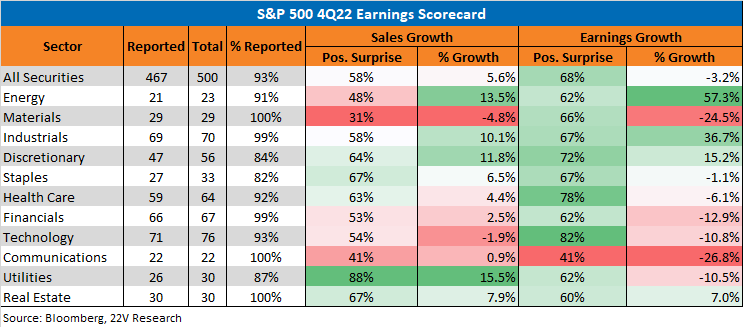
On an absolute basis, sales growth remained positive across all sectors other than Tech. Earnings, on the other hand, contracted on a y/y basis in 8 of 11 sectors. Four sectors posted positive earnings growth, led by Energy and Industrials, which benefited from the stronger than expected back end of the economy. Materials on the other hand saw a steep drop in EPS, mirroring declines in Communications. The lack of a clear trend in earnings across market segments is another factor contributing to the decline in market correlations, a theme we expect will continue to play out all year (unless a deep recession becomes clear, which is not true today, HERE)
The percent of earnings and sales beat estimate have both fallen since 2Q21, this cycle’s peak. Put into an historical context, the EPS beat rate is lower than normal, falling to its 47th %tile. Sales beats were better, falling to their 64th %tile. An important point is that BOTH are still higher than what was seen during past recessions, and that is particularly true for Sales beats. Nominal growth is not collapsing even as trend growth has clearly slowed.
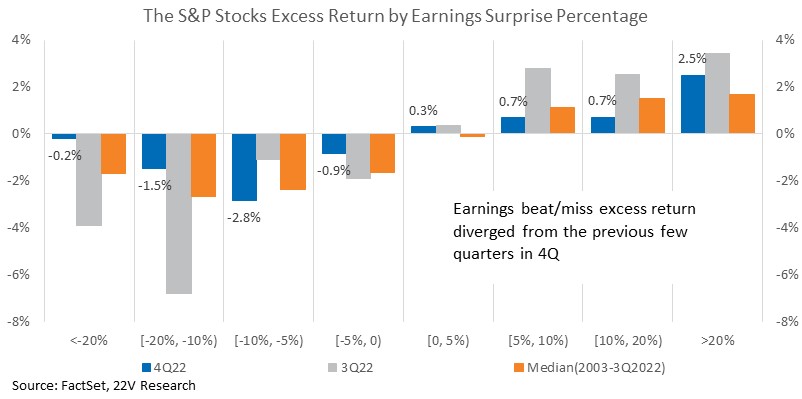
As a result of VERY low expectation for 4Q earnings, names missing estimate were less punished than normal for most groups (companies missing by -5 to -20% performed about in line with history, very few companies missed by -20%). That trend applied to beats too. Companies beating estimates gained less than normal. In other words, earnings release were less of an alpha generator during this reporting season. That outcome surprised us as we expect 1) financial conditions to be range bound (less PE drag), and 2) EPS growth to continue to slow. Macro uncertainty has increased more than we anticipated, and too strong inflation trends suggest an upward bias to financial conditions and more support for EPS, at least near-term. That outlook could easily shift if data (payrolls, wages, PMIs) weakens in early March. Again, macro vol is too high to make a strong call on that today.
Sentiment Rebound: S&P earnings sentiment expressed by managers during conference calls improved throughout earnings season. We measure sentiment using the Amenity NLP tool to “listen” to every S&P company conference call. The firming of sentiment is an objective confirmation of the stronger than expected macro data, especially within the services sector. This is another reason to expect a shallower 2023 EPS drawdown than was feared a few months back. Historically, earnings sentiment, capex expectations and S&P returns have been highly correlated. Both capex expectations and earnings sentiment trended during 4Q, rebounding from their cycle low.
The biggest risk to earnings this year is a rapid contraction in margins. Importantly, margin sentiment has rebounded over the past quarter. Actual margins will end reporting below bbg consensus estimates from the start of reporting. Margins will remain under pressure. What sentiment readings tells us is that the degree of margin contraction should slow, and there is increasing upside risk to profitability (more on margins HERE).
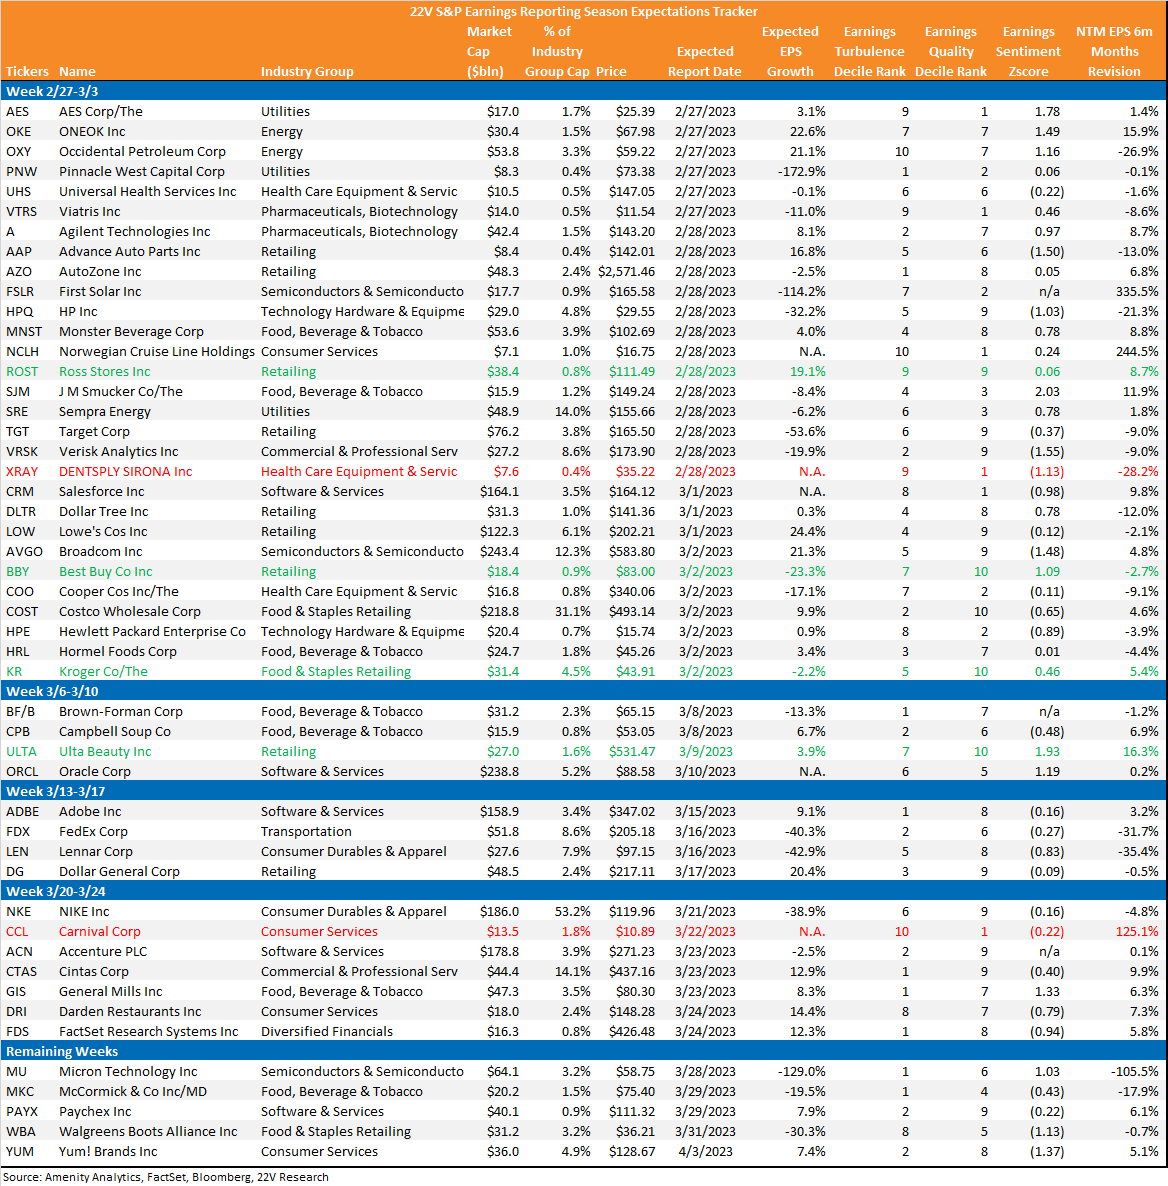
Final 4Q EPS Release Tracker: As earnings season is winding down, below we post all the remaining S&P names that haven’t published along with their expected EPS growth, Earnings Turbulence and Earnings Quality scores ranking, earnings sentiment score and 6 months earnings revision. Names with high Earnings Quality and positive earnings sentiment are highlighted green and are more likely to beat estimate. The names with high Earnings Turbulence and negative earnings sentiment are highlighted red, which are the names whose earnings are more at risk.