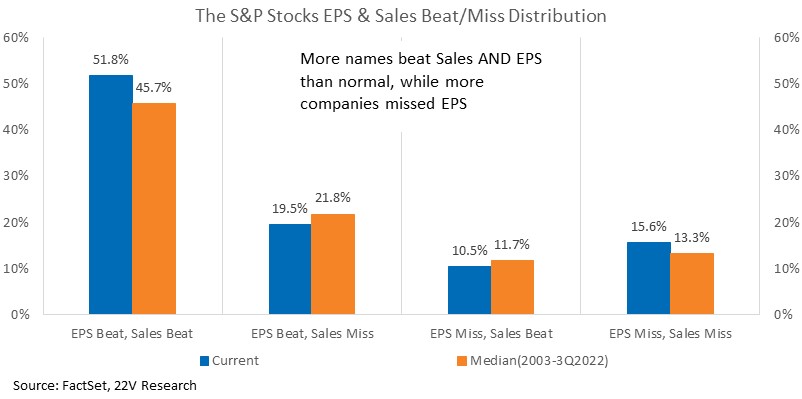
Though recession risk has dropped, forward NTM EPS estimate for S&P names has declined 6.2% from its peak. Consistent with the broad decline in EPS estimates, earnings misses were more common than normal this season. However, focusing on EPS alone misses some important trends. More companies than normal beat Sales targets. The S&P names beating BOTH sales and EPS has been higher than normal too. Over half of S&P stocks have posted top and bottom-line results above expectations.
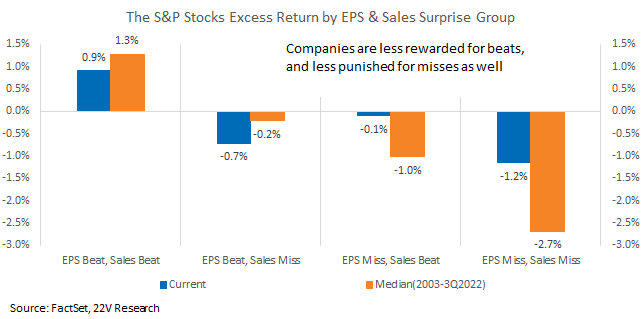
Beats were less rewarded this earnings season and misses less punished. We thought the opposite would happen. Investors having relatively low expectations for 4Q earnings may help explain the shift in the excess return pattern. Earnings are and will be under pressure. As such, we still favor focusing on high Quality names with strong EPS sentiment. 80% of names in that basket have beat estimates during 4Q reporting. We list the up coming reporters in the high Quality/Sentiment basket in the full report.
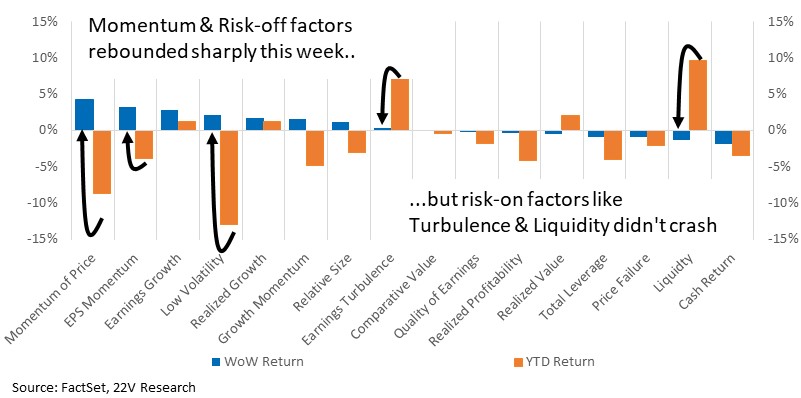
Shifting to factor internals, 2023 started with a sharp risk-on rotation as data and Fed rhetoric indicated lower near-term recession risk. Earnings Turbulence posted a 98th %tile gain while Low Vol stocks saw a 98th percentile decline. Over the past week, risk-off has retaken leadership, BUT risk-on factors have not collapsed. Unless wage growth remains too high and the Fed needs to significantly increase their expected rate hikes, 2023 won’t see the binary risk-on/off moves of 2022.

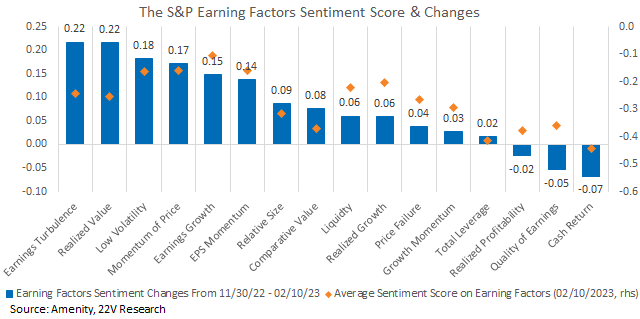
Relative to a quarter ago, earnings sentiment within high Earnings Turbulence names have increased the most, followed by Realized Value. High Earnings Quality and Profitability names saw their earnings sentiment decline in 4Q. According to 22V surveys, Quality is still the most favored factor this year, and we too prefer higher quality stocks given the slowing of growth and pressure on margins. BUT the breakdown of extremely high factor rank/return correlations means we should expect divergences WITHIN factors. Quality names with attractive sentiment and risk characteristics should outperform Quality stocks with weak pricing power and very low Volatility.
Earnings & Sales Best Less Rewarded: Though recession risk has dropped, forward NTM EPS estimate for S&P names has declined 6.2% from its peak. Consistent with the broad decline in EPS estimates, earnings misses were more common than normal this season. However, focusing on EPS alone misses some important trends. More companies than normal beat Sales targets. The S&P names beating BOTH sales and EPS has been higher than normal too. Over half of S&P stocks have posted top and bottom-line results above expectations.
Beats were less rewarded this earnings season and misses less punished. We thought the opposite would happen. Investors having relatively low expectations for 4Q earnings may help explain the shift in the excess return pattern from recent reporting seasons, where beats were rewarded more and misses were punished more as well over past few quarters.
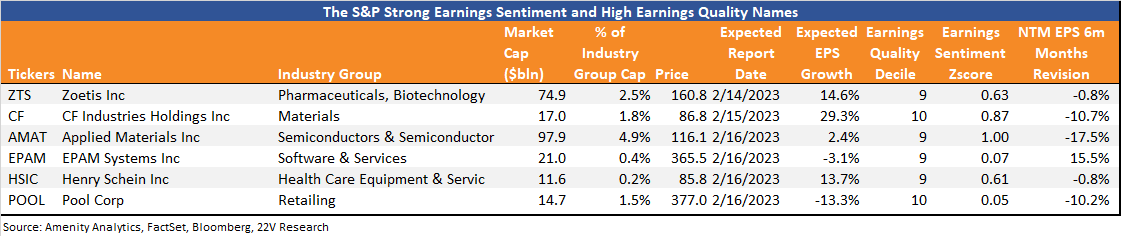
Earnings are and will be under pressure, and though broad negative revisions are expected this year, we still want to focus on beats and attempt to minimize misses. Earnings will be a more important driver of returns until there is a clear bottoming in growth. There will be 61 S&P stock reporting their earnings next week. Below we list the names with high Quality of Earnings ranking and positive earnings sentiment. These names are more likely to beat estimate as earnings has slowed. 80% of the names reported 4Q earnings falling in the long group have beat estimate.
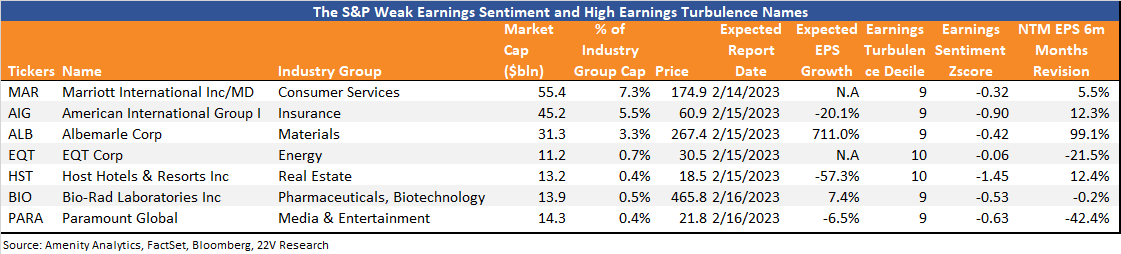
Below are the names with high Earnings Turbulence ranking and negative earnings sentiment. Their earnings are more volatile and more at risk of missing their estimates.
Less Binary Risk Rotations: 2023 started with a sharp risk-on rotation as data and Fed rhetoric indicated lower near-term recession risk. Earnings Turbulence posted a 98th %tile gain while Low Vol stocks saw a 98th tile decline. Over the past week, risk-off has retaken leadership, BUT risk-on factors have not collapsed. Unless wage growth remains too high and the Fed needs to significantly increase their expected rate hikes, 2023 won’t see the binary risk-on/off moves of 2022. Those rotations were motivated by rapid rate hikes, an extreme tightening of financial conditions, and concerns that a deep recession was about to start. All those conditions/concerns have eased. While uncertainty over the end points on growth and policy remains high, and given the strong recent gains in risk-on factors, we favor a more risk neutral factor stance.
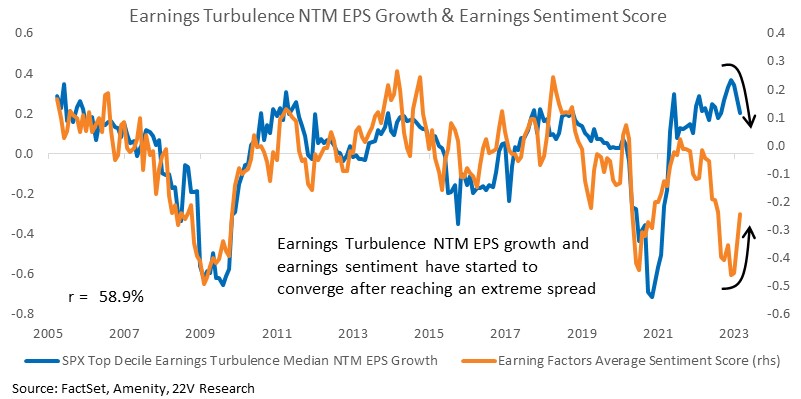
High Earnings Turbulence names started the year with VERY strong EPS growth expectations and very depressed management sentiment toward earnings. Normally that would suggest downside risk to the factor, but there were important offsets. 1) Every 22V survey showed the buyside had MUCH lower EPS estimates than the sell side; negative revisions were widely expected. 2) Earnings growth expectations within higher turbulence names were MUCH stronger than most other factors at a time when EPS are under pressure. Over the course of 4Q reporting, high Turbulence earnings sentiment started moving higher, reducing downside risks. Narrowing of this spread is another reason to expect more muted risk-off/on rotations this year.
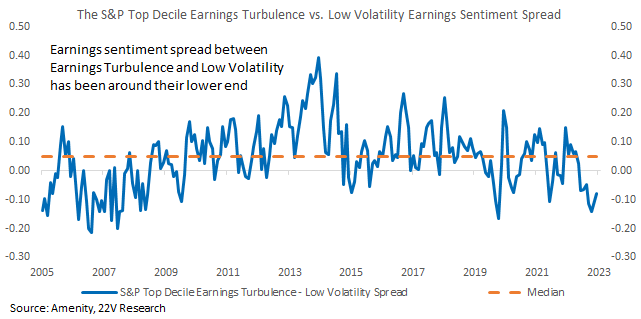
Between risk-on/off factors, the earnings sentiment spread of high Earnings Turbulence (risk-on) and Low Volatility (risk-off) is VERY low (so Turbulence sentiment is weaker than Low Vol sentiment). That spread contributes to our expectation that risk-off factor returns will improve in the short term. Earnings sentiment has improved recently across nearly all factors though, signaling a broad easing of EPS downside risk. Sentiment within high Turbulence names gained on Low Vol over the course of reporting season. Near-term, risk-off factors are likely to lead. When economic uncertainty declines meaningfully, companies with more earnings vol should be favored.
Relative to a quarter ago, earnings sentiment within high Earnings Turbulence names firmed the most, followed by Realized Value. High Earnings Quality and Profitability names saw their earnings sentiment decline in 4Q. According to 22V surveys, Quality is still the most favored factor this year, and we too prefer higher quality stocks given the slowing of growth and pressure on margins. BUT the breakdown of extremely high factor rank/return correlations means we should expect divergences WITHIN factors. Quality names with attractive sentiment and risk characteristics should outperform Quality stocks with weak pricing power and very low Volatility.