Macro uncertainty remains high, but recession risk has moved definitively (and objectively HERE) lower this year based on recent macro indicators. As we expected, S&P stocks correlations, which began breaking down in late-‘22 have moved sharply lower on both a short-term and long-term basis recently. The 22V Correlation Breakdown portfolio, has gained sharply this year (more details and latest constituents HERE). In less than 6 weeks the Correlation Breakdown portfolio is up nearly 18%, and macro uncertainty remains high, so a pause in gains should be expected. But like the tightening of financial conditions in 2022, lower correlations will remain an important theme throughout the year.
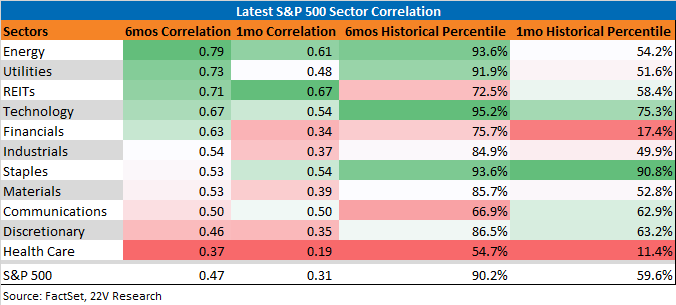
The recent breaking down of S&P correlation has been broad, impacting almost all sectors. Staples is the only GICS sector where correlations have increased YTD, and correlations remain relatively high in the sector, leaving room for further correlation breakdowns. Correlations within Health Care and Technology stocks have fallen the most this year, creating more dispersion and increased opportunities for stock picking within those sectors.

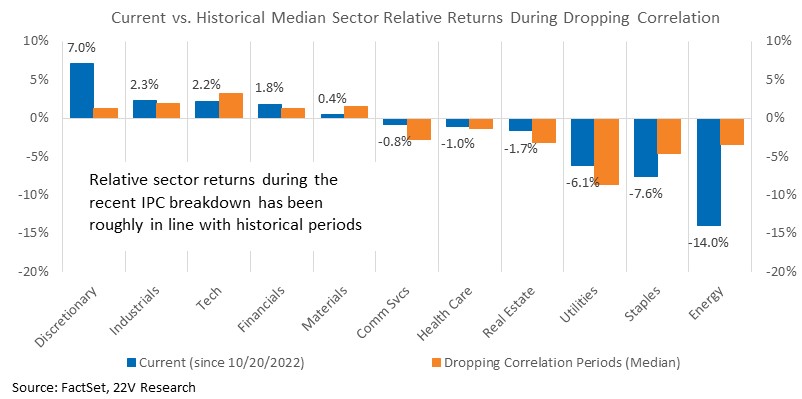
Typically, correlations spike on economic/market shocks, and Defensive groups lead during those periods. Cyclicals tend to do better as economic uncertainty eases. Since late October, the recent peak of S&P 6 months correlation, Discretionary and Industrials have been the leading sectors at the expense of Energy and Staples. Tech has underperformed relative to historical correlation breakdown periods and still has elevated short and longer-term IPC, leaving room for further gains and increased dispersion.
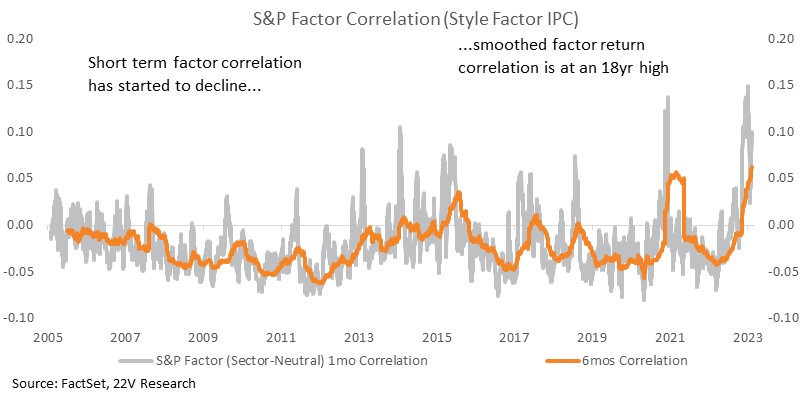
Like S&P stock correlation, factor return correlations are still exceptionally high, especially on a long-term basis. 6mo factor IPC is which has reached the historical high. Factor returns during the current drop in correlations has been tilted towards risk-on at the expense of risk-off and Momentum factors. Lower recession risk should help reduce factor correlations and support risk-on factors over time. Near-term, after the 99th %tile gain in risk-on factors this year, some pause should be expected.
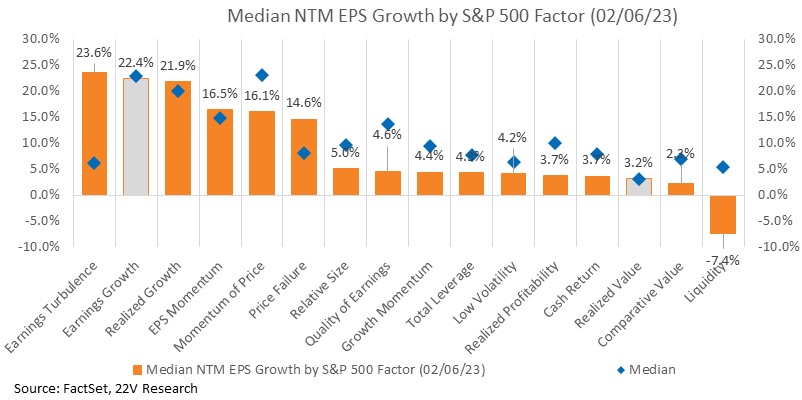
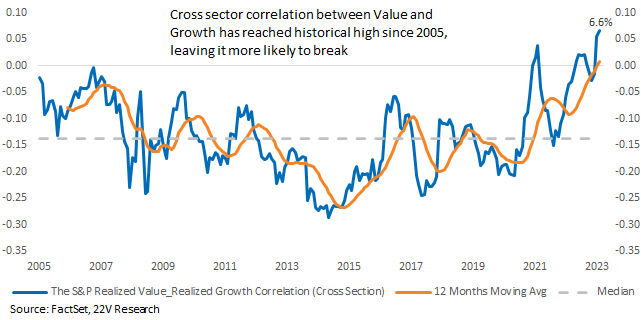
Ranking correlations between Realized Value and Realized Growth factors has turned positive recently, reaching their highest level since 2005. Put simply, stocks are more likely to be ranked as both Growth AND Value than at any since at least 2005. As a result, the return correlation between Realized Value and Realized Growth is also high. That leaves forward returns for Value and Growth more likely to move together near-term but creates opportunities for further correlation breakdowns longer-term. While recession risk is also low, and given the current consensus EPS estimates, we favor Growth names.
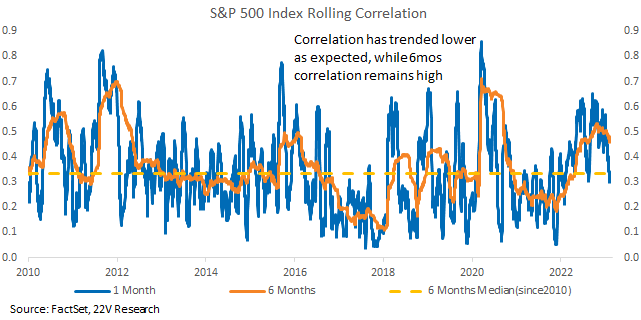
Correlation Breakdown within Sectors and Factors Accelerating: Macro uncertainty remains high, but recession risk has moved definitively (and objectively HERE) lower this year based on recent macro indicators. As we expected, S&P stocks correlations, which began breaking down in late-‘22 have moved sharply lower on both a short-term and long-term basis recently. Earnings reporting season has contributed to the decline, but elevated macro/policy risk was the reason correlations moved so high last year. As downside tail risk has eased, correlations have moved lower. Unless a deep recession becomes the new base case for the U.S. economy, smoothed correlations are biased lower.
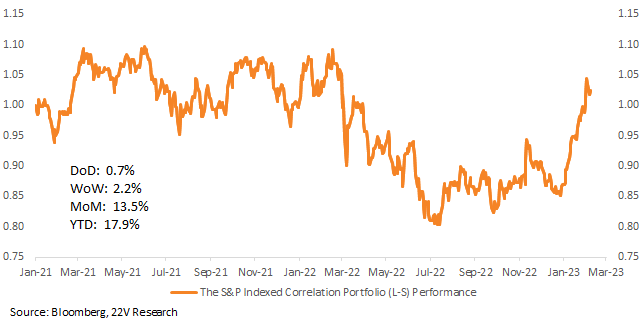
The 22V Correlation Breakdown portfolio, which is long the S&P names most negatively correlated with 6mo S&P correlation and short the names most positively correlated, has gained sharply this year (more details and latest constituents HERE). In less than 6 weeks the Correlation Breakdown portfolio is up nearly 18%, and macro uncertainty remains high, so a pause in gains should be expected. But like the tightening of financial conditions in 2022, lower correlations will remain an important theme throughout the year.
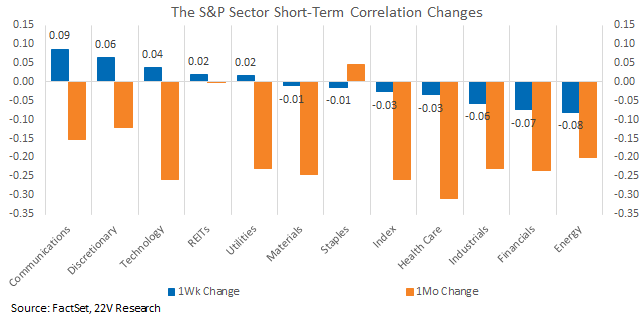
The recent breaking down of S&P correlation has been broad, impacting almost all sectors. Staples is the only GICS sector where correlations have increased YTD, and even within that space correlations have dropped recently. Correlations within Health Care and Technology stocks have fallen the most this year, creating more dispersion and increased opportunities for stock picking within those sectors.
Currently, Staples correlations remain relatively high compared to its historical range on both a short-term and long-term basis, leaving room for further correlation breakdowns within Staples. A deep recession is needed for the current level of Staples correlation to persist. Health Care has the lowest absolute and relative correlation among all sectors, leaving less room left for correlations to drop within the sector.
Typically, correlations spike on economic/market shocks, and Defensive groups lead during those periods. Cyclicals tend to do better as economic uncertainty eases. Since late October, the recent peak of S&P 6 months correlation, Discretionary and Industrials have been the leading sectors at the expense of Energy and Staples. Sector returns have been roughly in line with historical sector returns during historical correlation breakdown periods. Defensives in general have still elevated correlations and further to downside risk. Tech has underperformed relative to historical correlation breakdown periods and still has elevated short and longer-term IPC, leaving room for further gains and increased dispersion.
Similar to S&P stock correlation, factor return correlations are still exceptionally high, especially on a long-term basis. 6mo factor IPC is which has reached the historical high. A decline in long-term factor correlations is a high conviction call as their current level is unsustainable and shorter-term correlations are already moving lower.
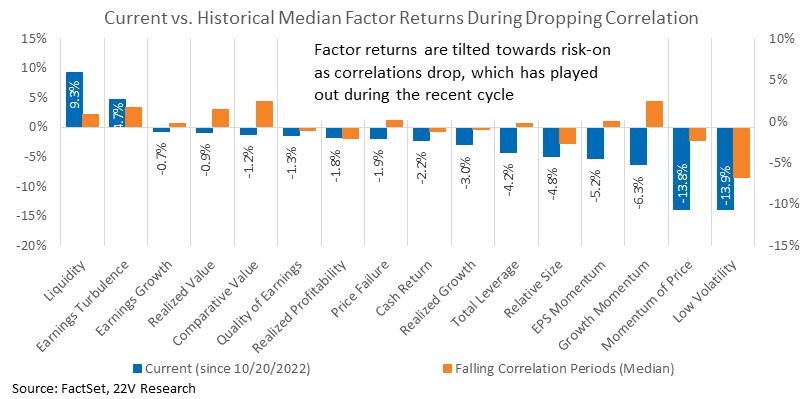
Factor returns during the current drop in correlations has been tilted towards risk-on at the expense of risk-off and Momentum factors. Importantly, Momentum and risk-off have an unusual level of rank overlap today (details HERE). Lower recession risk should help reduce factor correlations and support risk-on factors over time. Near-term, after the 99th %tile gain in risk-on factors this year, some pause should be expected.
Ranking correlations between Realized Value and Realized Growth factors has turned positive recently, reaching their highest level since 2005. Put simply, stocks are more likely to be ranked as both Growth AND Value than at any since at least 2005. As a result, the return correlation between Realized Value and Realized Growth is also high. That leaves forward returns for Value and Growth more likely to move together near-term but creates opportunities for further correlation breakdowns longer-term.
Index earnings growth is slowing (we expect a mid-single digit EPS drawdown in 2023), and overall economic activity is in a declining trend. While recession risk is also low, and given the current consensus EPS estimates, we favor Growth names.