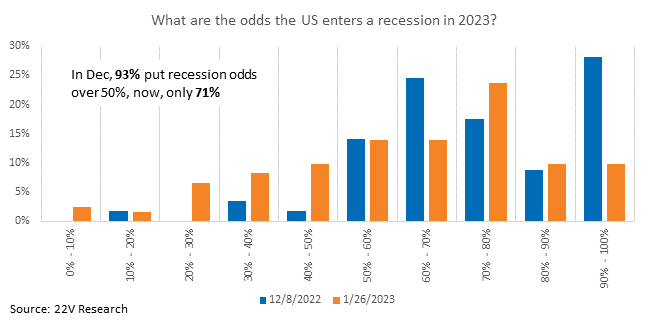
SUMMARY: The most common question as we have been on the road this week (and last week on zooms) is if the soft landing is fully discounted. Many seem to think it has been. When we polled investors in early December, 93% put the odds of a recession in 2023 over 50%. According to our most latest survey (HERE), 71% now put 2023 recession odds over 50%. Our recession odds are basically 50/50. So MOST, not all of a shift to a soft landing outcome seems to have been discounted. Data next week will help determine if soft landing odds are increasing or decreasing, and whether more discounting or a reversal is needed.

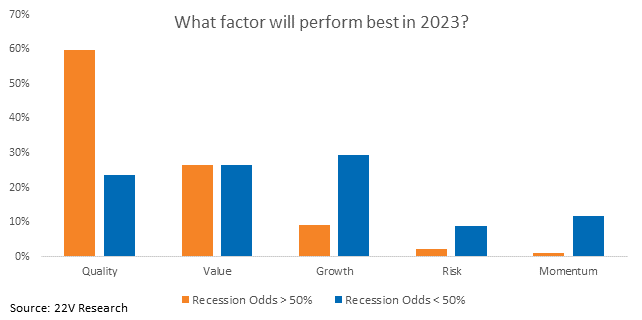
Everyone still likes the Quality factor, consistent with the still high odds of a recession. Risk-on factors and Momentum are still out of favor. Risk-on have been far and away the best performing factors YTD (+3.6%), while Momentum and risk-off factors have been the worst (-4.9% and -4.7% respectively). Under a non-recession scenario, risk-on factors would continue to perform well. Bottom line, the pain trade on the soft-landing call is still a higher market led by risk-on factors. Unfortunately, we took off our risk-on call off too early a week ago.
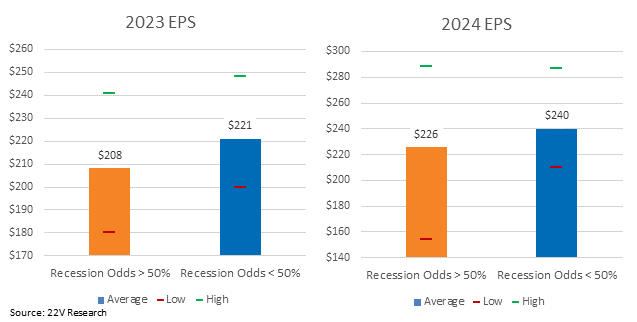
Respondents that put the odds of a recession over 50% put ’23 S&P EPS at $208 and ’24 EPS at 226. Those with less than 50% recession odds put ’23 EPS at $221 and ’24 at $240. There are a few big conclusions from this. 1) Buyside odds of an EPS washout (-20%) are VERY low. 2) Under a recession outcome, EPS growth is expected to be flat through 2024. If a recession is avoided, EPS growth is expected to be low single digit. From a fair value standpoint, $240 in 2024 EPS leaves more upside, but a large market move is dependent on either 1) much worse than expected EPS or 2) a shift in the equity risk premium. Internal positioning will be more important.
Initial jobless claims suggest no disruption in labor markets while continuing claims point to less hiring. But as Gerard noted (HERE) data in the GDP release was meaningfully weaker than expected. Given the backdrop of firm labor markets and below trend demand growth, this week’s data was consistent with a soft landing scenario. At least for now.
MARKET VIEWS: The most common question as we have been on the road this week (and last week on zooms) is if the soft landing is fully discounted. Many seem to think it has been. We decided to ask investors again in a survey on recession odds to help answer that question. Recall, when we polled investors in early December, 93% put the odds of a recession in 2023 over 50%. That was a large part of the reason we started 2023 with a call for risk-on factors to outperform and Defensives to suffer. According to our most latest survey (HERE), 71% now put the odds of a 2023 recession over 50%. Our recession odds are basically 50/50 and our base case is mild recession factored into our 2023 EPS call of 2014 ($210). So MOST not all of a shift to a soft landing outcome seems to have been discounted. Data next week will help determine if soft landing odds are increasing or decreasing, and whether more discounting or a reversal is needed.
A no-recession scenario in 2023 could leave S&P EPS closer to $220 and investors are NOT positioned for that outcome. Everyone still likes the Quality factor, consistent with the still high odds of a recession. Risk-on factors and Momentum are still out of favor. Risk-on have been far and away the best performing factors YTD (+3.6%), while Momentum and risk-off factors have been the worst (-4.9% and -4.7% respectively). Under a non-recession scenario, risk-on factors would continue to perform well. Bottom line, the pain trade on the soft-landing call is still a higher market led by risk-on factors. Unfortunately, we took off our risk-on call off too early a week ago.
Also in our most recent survey, 2023 EPS expectations of respondents that put the odds of a recession over 50% are $208. Those with less than 50% recession odds, expect S&P EPS of $221. For 2024 – those with >50% recession odds out EPS at $226 and those with <50% odds expect $240. There are a few big conclusions from this. 1) Buyside odds of an EPS washout (-20%) are VERY low. 2) Under a recession outcome, EPS growth is expected to be flat through 2024. If a recession is avoided, EPS growth is expected to be in the low single digits. From a fair value standpoint, $240 in 2024 EPS would leave more upside, but a large move from current levels is dependent on either 1) much worse than expected EPS or 2) a shift in the equity risk premium. A reacceleration in EPS next year is reasonable if economic growth improves in 2024 and wage growth declines (necessary for a soft landing). Even without a recession in 2023, some margin contraction is likely as inflation eases, and that will likely keep EPS flattish ($221) on the year.
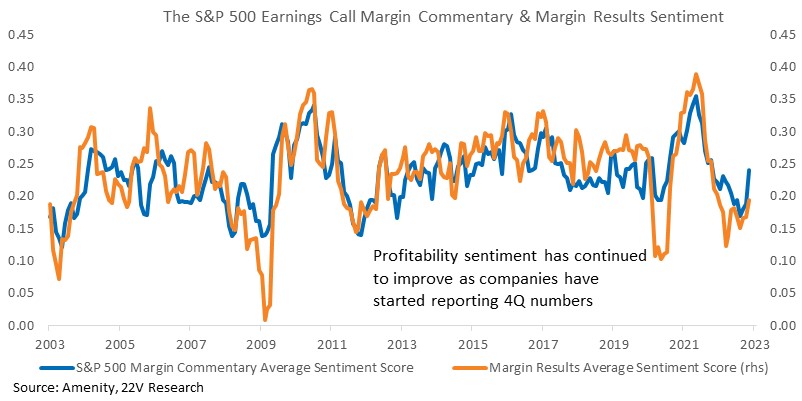
High frequency data suggests an improving outlook for earnings growth. Nominal GDP growth remains firm, reducing the risk of big negative revisions to revenue estimates. That has been confirmed during 4Q reporting with more companies than normal beating top line estimates. The biggest risk to EPS estimates is a large decline in profitability. Management sentiment toward margins started improving toward the end of 3Q reporting, and that has accelerated do far in 4Q. Management is LESS concerned about current and future profitability than they were a few quarters ago. Management views are consistent with macro data showing lower recession odds.
Economic Data Weakening Despite Strong Labor Indicators: Initial jobless claims suggest no disruption in labor markets while continuing claims point to less hiring. But as Gerard noted (HERE) data in the GDP release was meaningfully weaker than expected. Real PCE growth estimates are likely to be revised lower. 1Q23 is setting up to be weak from an underlying demand view, so 10yr yields are unlikely move much higher. Given the backdrop of firm labor markets and below trend demand growth, this week’s data was consistent with a soft landing scenario. At least for now.
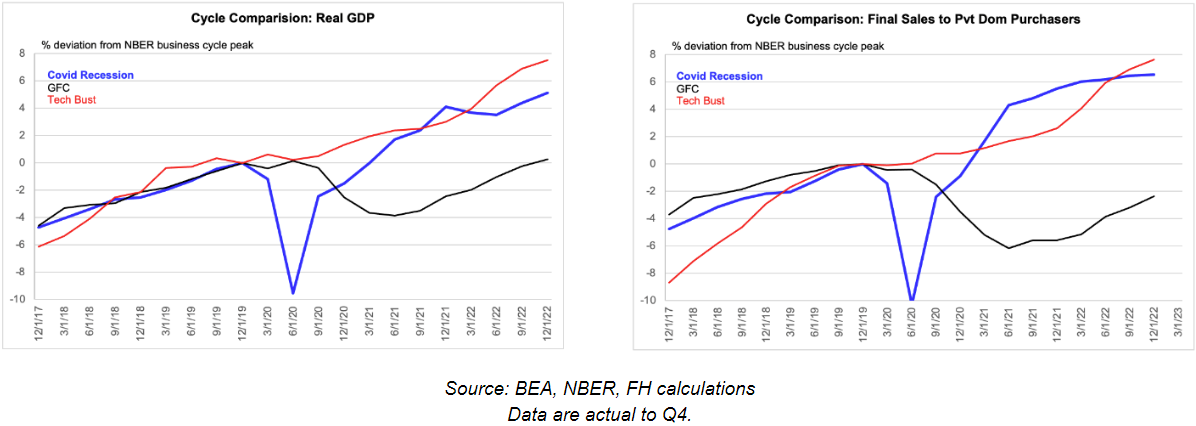
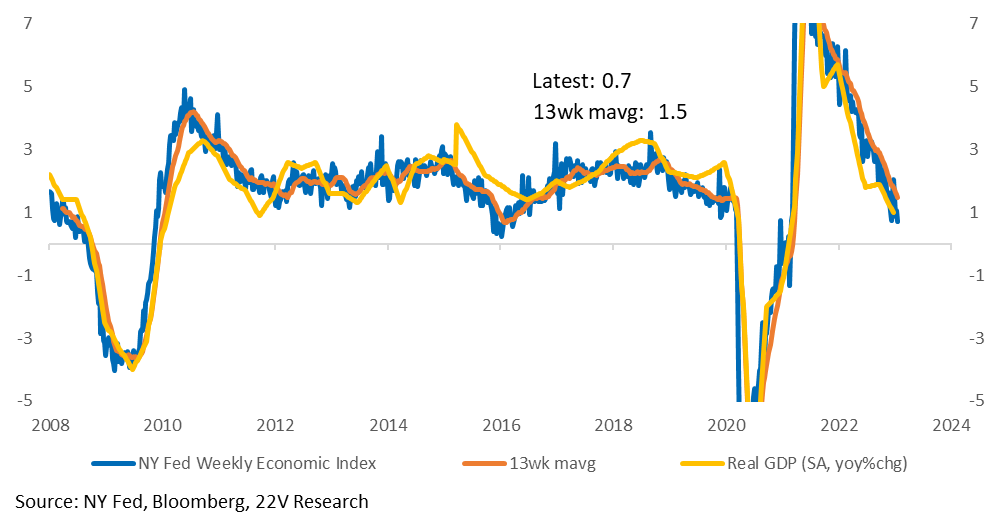
The NY Fed Weekly Economic Index (WEI) confirmed some of the softness in the GDP report. Underlying demand is clearly growing at a below trend pace. Consumer confidence readings and some early stage production readings (steel in particular) were offsets to broad-based weakness. Firming early indicators is another sign that deep recession odds are falling. That could change, but for now, the debate is around whether there will be a mild or no recession.