Inflation looks to be heading in the right direction this year with wage growth remaining in a downtrend (HERE) and consumer-based inflation expectations easing. That increases the odd a recession can be avoided, and the economy moves toward a “normal” backdrop.
This report is in two parts. In the first, we classified stocks as Deep Cyclicals, Early Cyclicals and Defensives by running industry group relative return correlations with ISM PMI since 1990. We also looked at the median return for each group during different macro regimes. Early Cyclicals including Discretionary, Technology and Communications tend move 3 to 12 months ahead of the PMI peaking or troughing and perform the best during “Normal” regimes. Defensives including Staples, Health Care, Utilities, and REITs are less correlated with PMIs and tend to perform best in Transitions and Recessions.
In the second part, we focus on Factors. Based on our Macro Regime Classification Model (details HERE), the odds of growth stabilizing have increased since late last year, but the backdrop is still classified as a “Transition”, a rare period where Low Vol, Value, and Momentum perform best relative to Turbulence, Leverage, and Growth. Historically, a shift from Transition to Normality leads to large negative performance reversals in Low Vol, Realized Value, and Momentum. Factors that benefit most from a firming of Growth are risk-on factors and Earnings Growth.

Recession odds are still high though, and more wage growth/employment data is needed to determine if a recession can be avoided. There are two factors, Earnings Growth and Price Failure, that perform well in BOTH Normal and Recession periods. Today, Transportation and Energy are the industry groups most exposed to Earnings Growth while Tech Hardware and Consumer Durables have the lowest exposure.
Interestingly, industry group return correlations relative to Earnings Growth have diverged from their factor exposure. Energy returns have been negatively correlated with Earnings Growth while Tech Hardware is positively correlated. Energy remains a macro driven sector where factor exposures are less predictive of future returns. Groups like Tech Hardware, Retailing, and Software are more likely to follow overall trends in Earnings Growth factor returns.
Macro Backdrop Improving: Inflation looks to be heading in the right direction this year with wage growth remaining in a downtrend (HERE) and consumer-based inflation expectations easing. That increases the odds a recession is avoided and the economy moves toward a “normal” backdrop. That shift has important implications for factor and industry group returns trends.
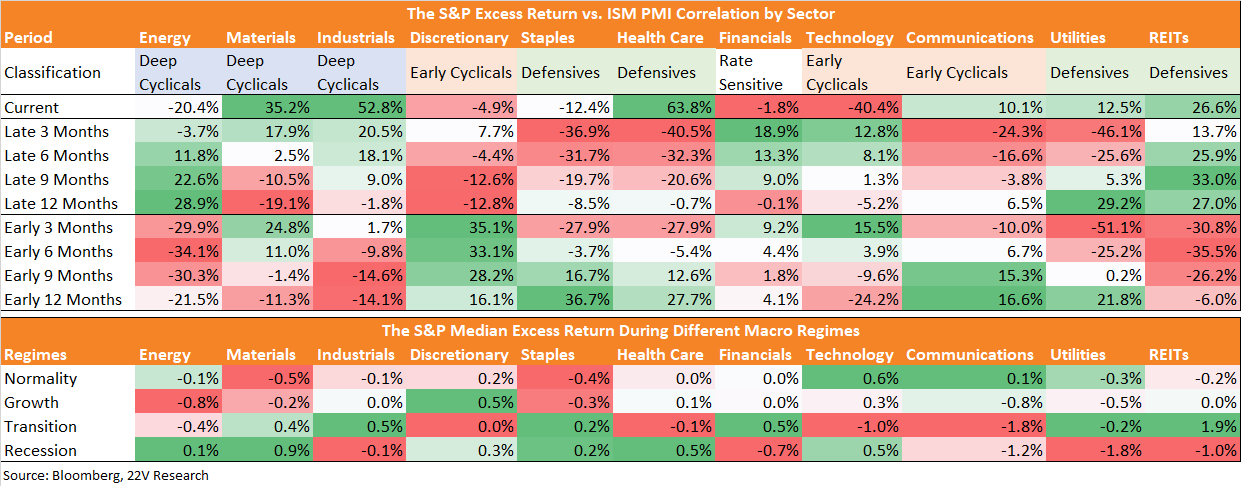
Sector & Industry Group Classification: As with factors, sector and industry group returns under different economic regimes tend to diverge. We classified stocks as Deep Cyclicals, Early Cyclicals, and Defensives by running industry group relative return correlations with ISM PMI since 1990. We also looked at the median return for each group during different macro regimes to dynamically classify sectors and industry groups. Early Cyclicals including Discretionary, Technology, and Communications tend to move 3 to 12 months ahead of the PMI peaking or troughing and perform the best during “Normal” regimes. Defensives including Staples, Health Care, Utilities, and REITs are less correlated with PMIs and tend to perform best in Transitions and Recessions.
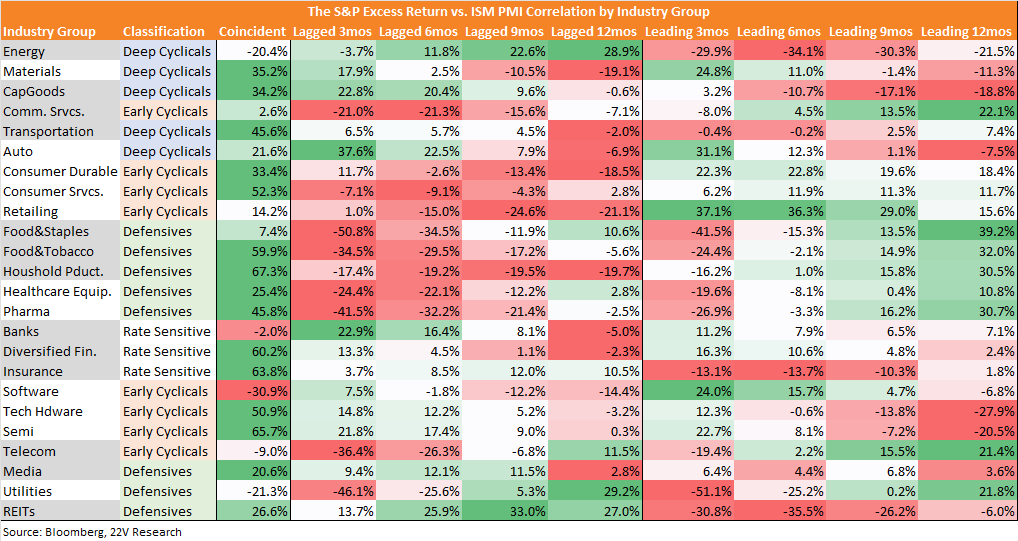
Correlations at the industry group level show similar characteristics as the sector level readings, except Commercial Services which has acted more like an Early Cyclical than its sector classification, Autos which have acted like a Deep Cyclical, and Media which is just less correlated with the cycle. Moving toward a Normal regime, which would imply a firming/increase in PMIs, should benefit Early Cyclical industry groups, especially Retail, and Software, and to a lesser extent Materials and Semis. For Defensives to remain bid, investors need to discount further declines in leading indicators. Under that backdrop, Food and Staples, Pharma, and Utilities should perform best.
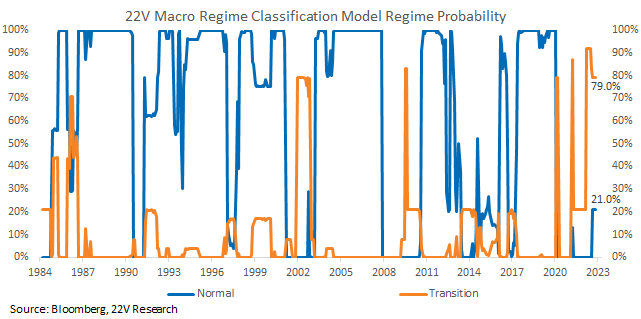
Factor Correlations & Exposures: The probability of Normality has increased since late last year based on our Macro Regime Classification Model (details HERE), but the backdrop is still classified as a “Transition”, a rare period where Low Vol, Value, and Momentum perform best relative to Turbulence, Leverage, and Growth. Historically, a shift from Transition to Normality leads to large negative performance reversals in Low Vol, Realized Value, and Quality. The factors that benefit most from a firming of Growth are risk-on factors and Earnings Growth.
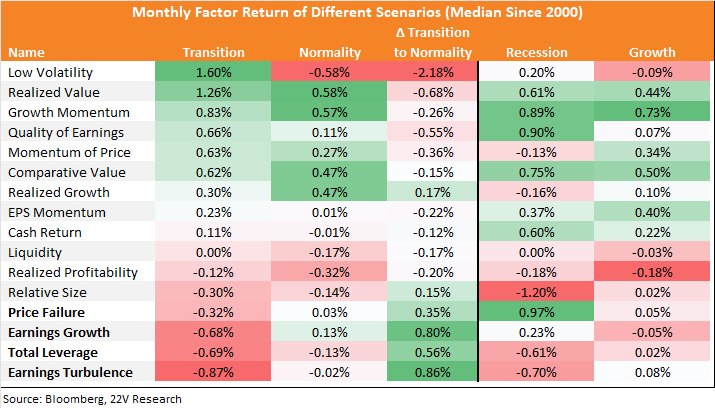
Recession odds are still high though, and more wage growth/employment data is needed to determine if a recession can be avoided. There are two factors, Earnings Growth and Price Failure, that perform well in BOTH Normal and Recession periods. Today, Transportation and Energy are the industry groups most exposed to Earnings Growth while Tech Hardware and Consumer Durables have the lowest exposure.
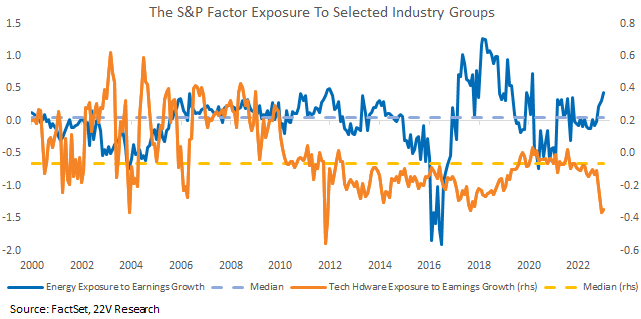
Interestingly, industry group return correlations relative to Earnings Growth have diverged from their factor exposure. Energy returns have been negatively correlated with Earnings Growth while Tech Hardware is positively correlated. Energy remains a macro-driven sector where factor exposures are less predictive of future returns. Groups like Tech Hardware, Retailing, and Software are more likely to follow overall trends in Earnings Growth factor returns.
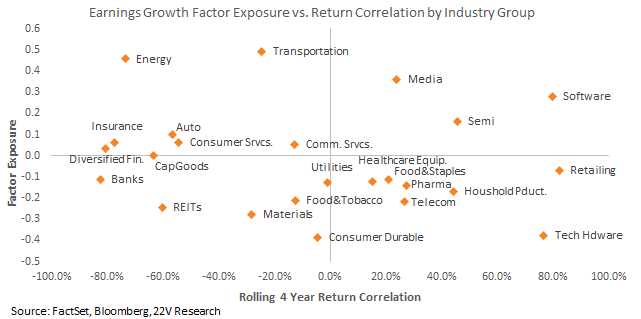
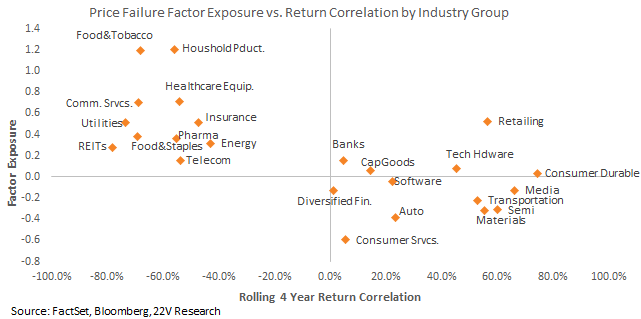
A similar divergence is taking place within Price Failure as well, with Food & Tobacco and Household Products 1) most exposed Price Failure and 2) their returns negatively correlated with the factor. Consumer Services and Auto are most negatively exposed to Price Failure, and their returns are most positively correlated with Price Failure. As with Energy, Food, Household Products, and Healthcare names appear to be trading off macro forces, while Materials, Semis, Transports, etc. are more likely to follow factor trends.