Back Technical Analysis

Dial B for Bubble – Part 2

Published on December 28, 2022

∙ Download the PDF Report

By

John Roque

Back on November 9, 2022, I sent out some market commentary titled, “Dial B for Bubble.” The “Dial B for Bubble” title is an homage to the film noir classic, “Dial M for Murder” which starred the exceptionally beautiful Grace Kelly and was directed by the needs-no-introduction, Alfred Hitchcock. Given the action yesterday it seemed like a good idea to reprise the title because market bubbles continue to deflate.

Market history is chock-full of examples of asset bubbles. For example, famous historical bubbles have included Tulipmania (17th century Holland), the Mississippi Bubble (early 18th century France), the South Sea Bubble (early 18th century England), the Roaring 20s (1924 – 1929 US), the Japanese Bubble (mid-late 80s Japan; and Taiwan, too), the Tech Bubble (late 1990s – early 2000s), and the Housing Bubble (2003 – 2006). There’ve been other less well-known versions like the Spanish Merino Sheep Bubble, the Mulberry Tree Bubble, the Tea Bubble, the Cochin Chicken Bubble, the Ostrich Feather Bubble and my personal favorite, the Rabbit Bubble which occurred in Japan in the early 1870s.

But what makes bubbles exceedingly interesting is, initially, the excessive speculation on the way up attended by all sorts of newly crowned successful investors and new-era gobbledygook, and then secondarily, the sheer terror on the way down. Each bubble (check paragraph above) gets a label or title which ultimately becomes an unflattering epithet.

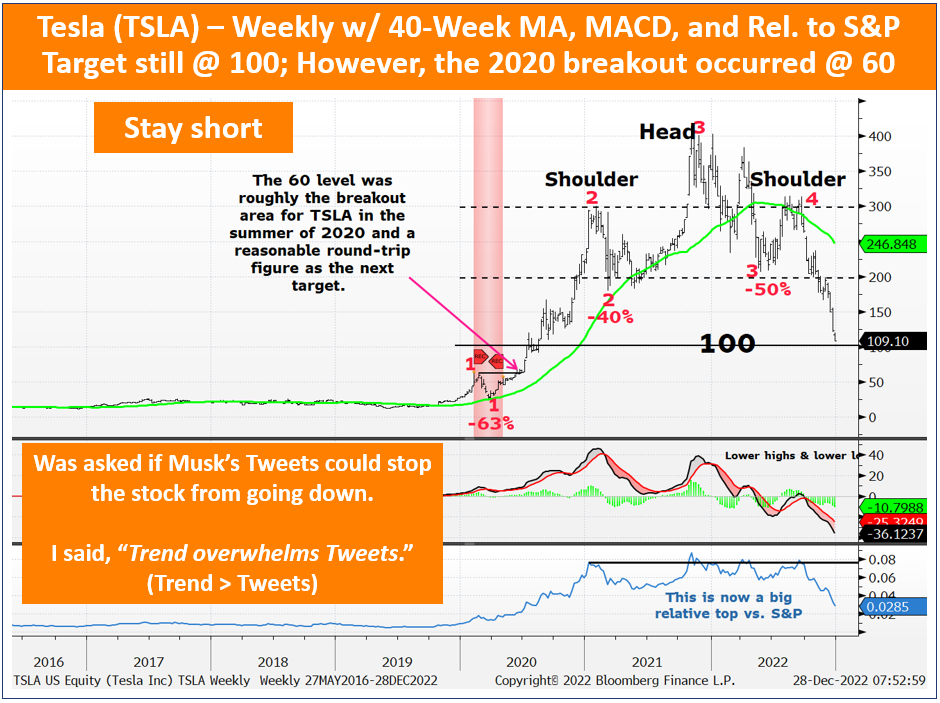
Tesla – Weekly w/ 40-Week MA, MACD, and Rel. to S&P 500. My target has been at the $100 level for some time but it’s not a stretch to figure $60 will be hit (see chart).
Chart

Description automatically generated

While nobody could’ve known when prices would have peaked on the way up for each of the historic bubbles listed above, they were all measurable simply by monitoring the amplitude of their price gains. This is contrary to what Ben Bernanke said on Oct 15, 2002, when he gave an “Asset-Price “Bubbles” and Monetary Policy” talk before the New York Chapter of the National Association for Business Economics. Bernanke said, “…the Fed cannot reliably identify bubbles in asset prices.” My response then and my response today is, “The Fed cannot reliably identify bubbles in asset prices because the Fed does not pay close enough attention to asset prices.” Heck, the Fed hardly pays enough attention to goods prices so how can we expect them to monitor asset prices, too.

The current period – some have termed it the “Everything Bubble” – has included MEME stocks and FOMO stocks (both of which spawned ETFs; I think the plethora of ETFs is also a bubble but that’s a subject for another day), NFTs, bond prices (when rates were repressed and, in many instances negative), VC, home prices, crypto, Growth Relative to Non-Growth, and COVID-beneficiaries, in general.

More importantly now, however, and this is especially so given where we are in this current bear cycle, is what happens in the aftermath of bubbles popping. In general, bubbles fully pop when the asset goes down 80% – 90%. For example, the DJIA declined 90% from Sept 1929 – July 1932, the Nikkei lost 80% into its 2003 low and it finally bottomed after losing 82% into its 2008 trough, NASDAQ dropped 78% from March 2000 – October 2002 while the NASDAQ 100 lost 83% and the SOX 85% over the same period, and the S&P Homebuilding Index had a 92% cliff-dive from July 2005 – November 2008.
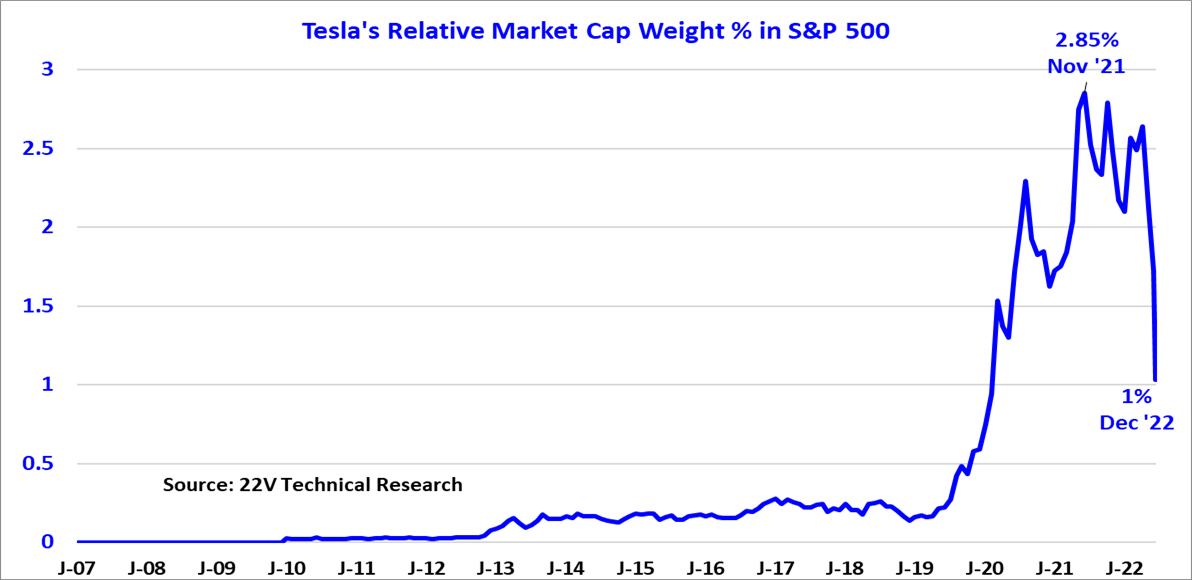
Source: 22V Research

Though Tesla is down almost 75% from its November 2021 peak a full bubble popping for it would see the stock between $40 – $80. It was clear on the way up and it’s clear, now, on the way down that the stock was a bubble and, while I have no animus at all for Elon Musk, he was a pluperfect example of the “Cult of Personality” bubble as was, of course, Sam Bankman- Fried. As the annotation in the first chart showed, I’m going with $60 as the next downside target (beneath my initial $100 target) as that was the breakout level for Tesla in the summer of 2020.

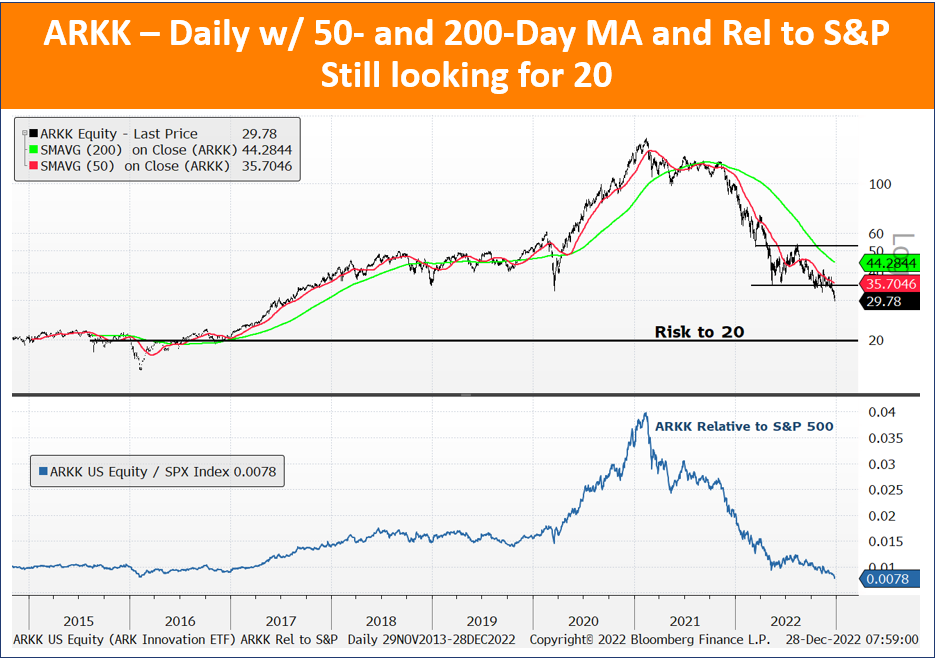
Tesla’s bubble fueled – or vice versa if you will – the ARK Innovation ETF bubble. ARKK went up spectacularly by nearly 700% (!) over 240 weeks from mid-July 2016 to mid-Feb 2021. Its proprietor was also a “Cult of Personality” charter member. The ARKK ETF is down 81% from its mid-Feb 2021 peak – and has solved for the “easy” part of the bubble popping decline – but I’ve been estimating that it has risk to $20 by showing the following chart in our weekly 22V Research Webinars. This quote from Benjamin Anderson’s “Economics and the Public Welfare” (1949) is as apropos for this era as it was for the Roaring 20s – “Every era of speculation brings forth a crop of theories designed to justify the speculation, and the speculative slogans are easily seized upon. The term ‘new era’ was the slogan for the 1927 – 1929 period. We were in a ‘new era’ in which old economic laws were suspended.” Sounds familiar.
Chart

Description automatically generated

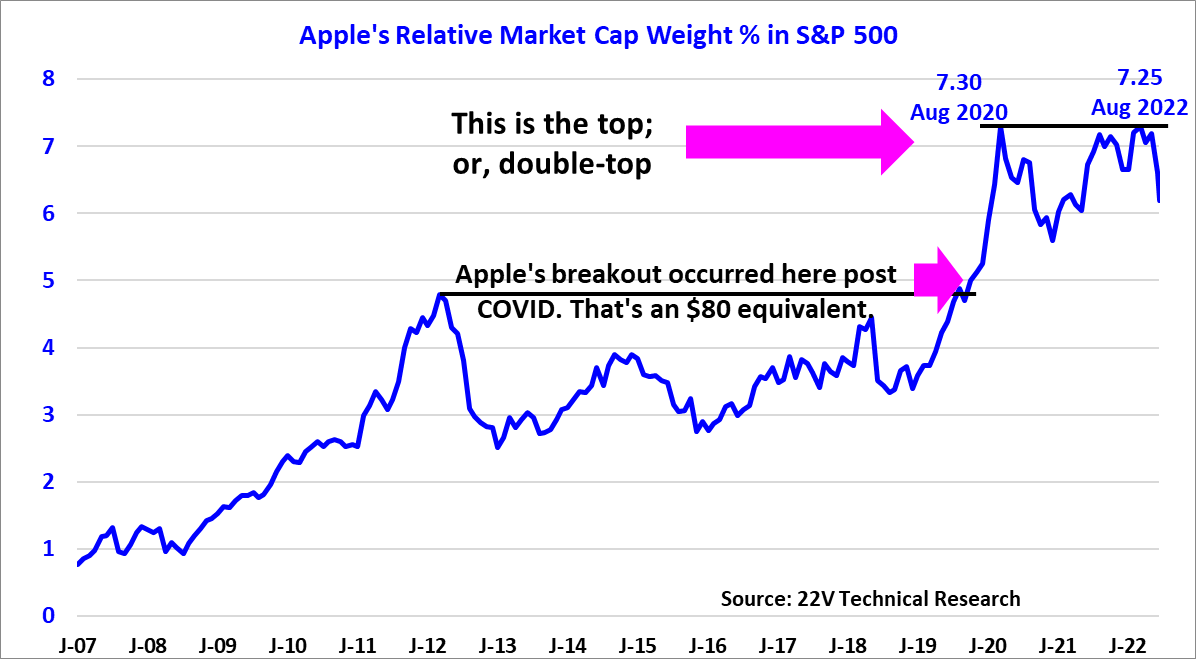
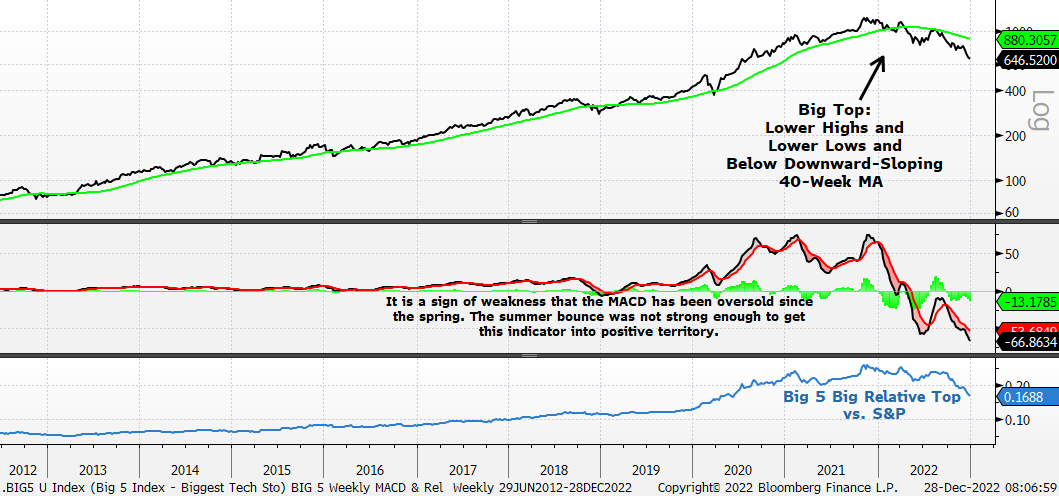
Big 5 Index – AAPL, AMZN, GOOGL, MSFT, and TSLA – w/ 40-Week MA, MACD, and Relative to S&P 500. The market cannot stop going down until this index bottoms.
Chart, line chart

Description automatically generated

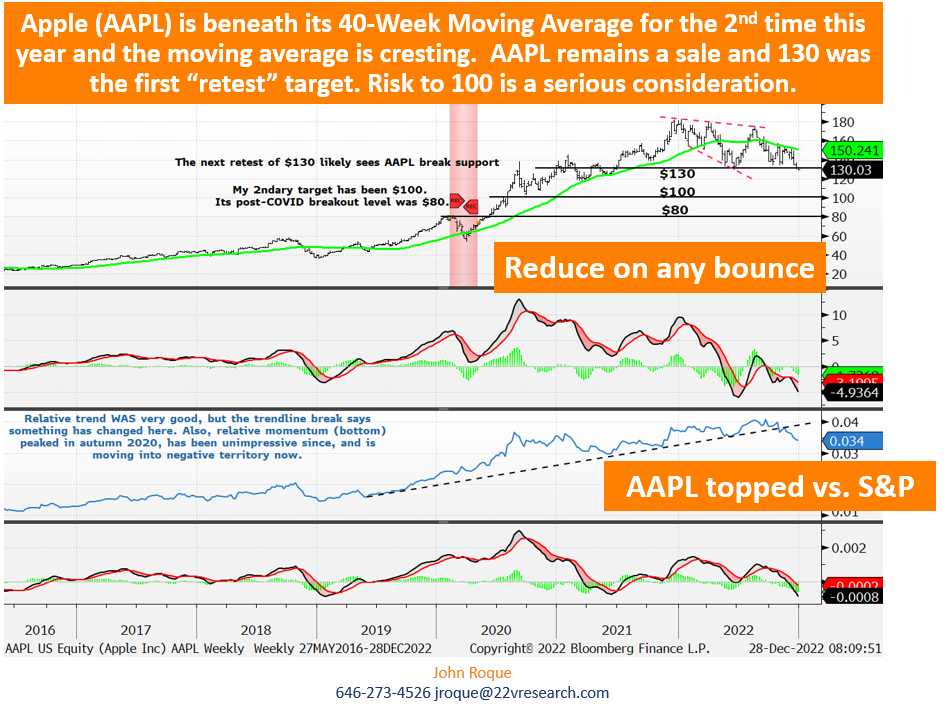
And, of course, the same is true for the Capo di Tutti Capi.
A picture containing chart

Description automatically generated
Source: 22V Research

DISCLOSURES AND DISCLAIMERS

Analyst Certification

The analyst, 22V Research Group, primarily responsible for the preparation of this research report attests to the following: (1) that the views and opinions rendered in this research report reflect his or her personal views about the subject companies or issuers; and (2) that no part of the research analyst’s compensation was, is, or will be directly related to the specific recommendations or views in this research report.

Analyst Certifications and Independence of Research.

Each of the 22V Research analysts whose names appear on the front page of this report hereby certify that all the views expressed in this Report accurately reflect our personal views about any and all of the subject securities or issuers and that no part of our compensation was, is, or will be, directly or indirectly, related to the specific recommendations or views of in this Report.

22V Research (the “Company”) is an independent research provider. The Company is not a member of the FINRA or the SIPC and is not a registered broker dealer or investment adviser. 22V Research has no other regulated or unregulated business activities which conflict with its provision of independent research.

22V Research, LLC is a professional services and independent publication organization. 22V Research, LLC is not a securities broker-dealer, not a member of the Financial Industry Regulatory Authority (FINRA), not a registered investment advisor (RIA) and not a member of SIPC.

Securities transactions, when offered, are offered by 22V Securities, LLC through LPS Capital, LLC. Certain employees of 22V Securities, LLC are dually registered as securities representatives of LPS Capital, LLC or Analyst Hub Securities, LLC. 22V Securities, LPS Capital and Analyst Hub Securities are members FINRA, SIPC.

https://brokercheck.finra.org/

Current Ratings Definition.

SECTOR OUTPERFORM: An “outperform” rating anticipates the company will outperform the S&P Regional Banking Index (peer group).

SECTOR PERFORM: A “market perform” rating anticipates the company will perform in line with the S&P Regional Banking Index (peer group).

SECTOR UNDERPERFORM: An “underperform” rating anticipates the company will underperform the S&P Regional Banking Index (peer group).

Limitation Of Research And Information.

This Report has been prepared for distribution to only qualified institutional or professional clients of 22V Research Group. The contents of this Report represent the views, opinions, and analyses of its authors. The information contained herein does not constitute financial, legal, tax or any other advice. All third-party data presented herein were obtained from publicly available sources which are believed to be reliable; however, the Company makes no warranty, express or implied, concerning the accuracy or completeness of such information. In no event shall the Company be responsible or liable for the correctness of, or update to, any such material or for any damage or lost opportunities resulting from use of this data. Nothing contained in this Report or any distribution by the Company should be construed as any offer to sell, or any solicitation of an offer to buy, any security or investment. Any research or other material received should not be construed as individualized investment advice. Investment decisions should be made as part of an overall portfolio strategy and you should consult with a professional financial advisor, legal and tax advisor prior to making any investment decision. 22V Research Group shall not be liable for any direct or indirect, incidental or consequential loss or damage (including loss of profits, revenue or goodwill) arising from any investment decisions based on information or research obtained from 22V Research Group.

Reproduction And Distribution Strictly Prohibited.

No user of this Report may reproduce, modify, copy, distribute, sell, resell, transmit, transfer, license, assign or publish the Report itself or any information contained therein. Notwithstanding the foregoing, clients with access to working models are permitted to alter or modify the information contained therein, provided that it is solely for such client’s own use. This Report is not intended to be available or distributed for any purpose that would be deemed unlawful or otherwise prohibited by any local, state, national or international laws or regulations or would otherwise subject the Company to registration or regulation of any kind within such jurisdiction.

Copyrights, Trademarks, Intellectual Property.

22V Research Group, and any logos or marks included in this Report are proprietary materials. The use of such terms and logos and marks without the express written consent of 22V Research Group is strictly prohibited. The copyright in the pages or in the screens of the Report, and in the information and material therein, is proprietary material owned by 22V Research Group unless otherwise indicated. The unauthorized use of any material on this Report may violate numerous statutes, regulations and laws, including, but not limited to, copyright, trademark, trade secret or patent laws.