Back Quantitative

Quant Market in Numbers:  Slower Growth Favors Quality Growth

Published on December 19, 2022

Download the PDF Report

By

Dennis DeBusschere

Brian Herlihy

Sophia Wang

Kevin Brocks

Narratives have shifted away from the slower growth Fed pivot hopes that helped drive stocks higher in October and November. Risk-off factors are leading internals, tracing the weakening of economic growth and discounting uncertainty about upcoming earnings. Slower growth rather than changes in financial conditions is likely to be the more important driver of stocks in 2023.

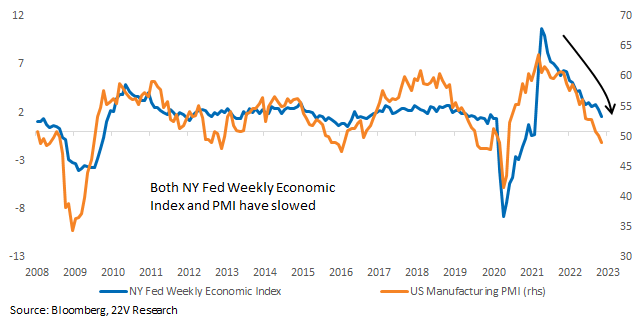
Economic indicators such as US PMI and NY Fed Weekly Economic Index both are trending lower, and the service indicator retail sales reading also missed expectations last week. As we discussed in a report last week (HERE), NTM EPS earnings revision have fallen -3.7% from their peak. Even if a deep recession can be avoided next year, a sharp slowdown/mild recession (our base case) means revisions will continue to fall from here. The slowdown is here, and central banks are still erring on the side of crushing inflation.

We ran factor return correlations with the NY Fed Weekly Economic Index, a high-frequency coincident indicator of demand. We also looked at correlations with the US Manufacturing PMI, a lower frequency leading indicator. Both sets of correlations show similar trends and favor Low Volatility, Realized Growth, and Quality of Earnings during periods of slowing economic activity.

Chart, waterfall chart

Description automatically generated

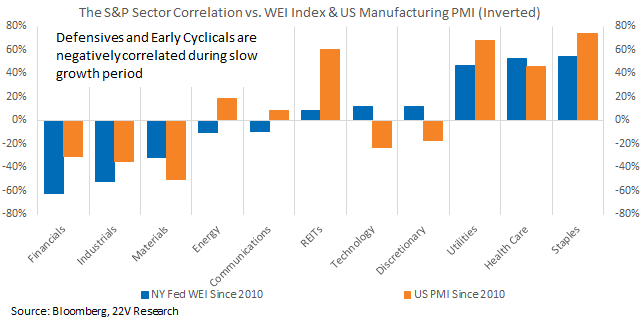
Sector return correlations support a Defensives position with Staples, Health Care, and Utilities performing best as growth indicators decline. Deep Cyclicals and the rate-sensitive Financials sectors struggle the most. Early Cyclicals correlations are mixed. Further slowing of the WEI is a mild positive for Early Cyclicals, while declining PMIs are a mild negative. At the edges, sector performance relationships with growth a strong and consistent, but for Early Cyclical groups, sector trends are weak and OTHER factors (fundamental and macro) are important.

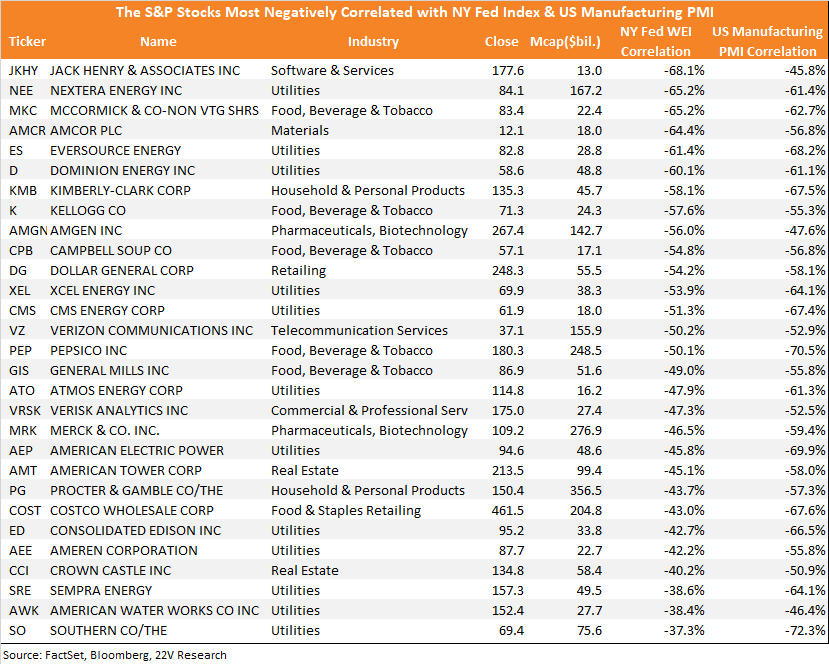
At the end of this report we list the stocks with the more negative correlations with changes in NY Fed WEI and the US Manufacturing PMI. The basket is more Defensive, consistent with the highly negative correlations of Defensives to slowing growth.

Slower Growth Favors Quality Growth: Narratives have shifted away from the slower growth, Fed pivot hopes that helped drive stocks higher in October and November. December’s focal points have been the rapid deterioration of growth indicators and more hawkish than expected commentary from the Fed and ECB. Financial conditions have tightened modestly but are and will likely remain range bound. Risk-off factors are leading internals though, tracing the weakening of economic growth and discounting uncertainty about upcoming earnings. Slower growth rather than changes in financial conditions is likely to be the more important driver of stocks in 2023. Economic indicators such as US PMI and NY Fed Weekly Economic Index both are trending lower, and the service indicator retail sales reading also missed expectations last week. The slowdown is here, and central banks are still erring on the side of crushing inflation.
Chart

Description automatically generated

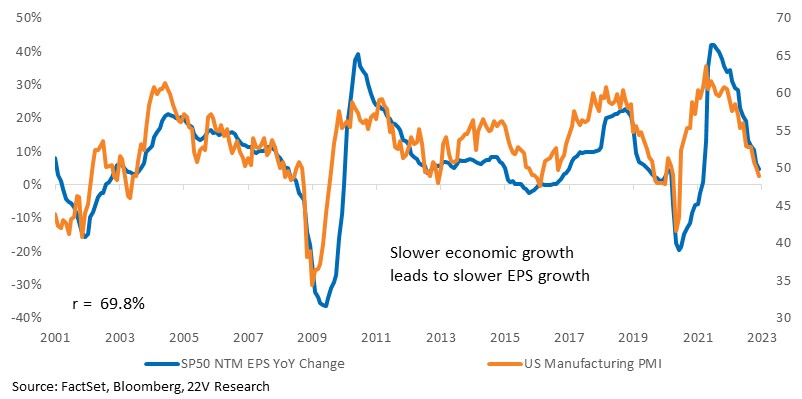
Historically, the S&P earnings trends are positively correlated with economic indicators. Slower growth begets declining S&P earnings growth expectations. 4Q estimates have remained firm but expect to see the typical pattern of negative revisions over the weeks heading into the start of reporting.
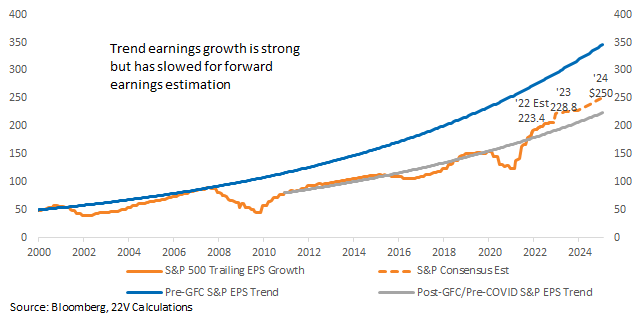
Forward earnings estimates for 2023 and 2024 continue to suggest positive growth at roughly the post-GFC and pre-COVID trend. Hopes of recouping the pre-GFC trend anytime soon are gone, but trend earnings are off their post-GFC, trend. As we discussed in a report last week (HERE), NTM EPS earnings revision have fallen -3.7% from their peak. Even if a deep recession can be avoided next year, a sharp slowdown/mild recession (our base case) means revisions will continue to fall from here.
Chart, line chart

Description automatically generated

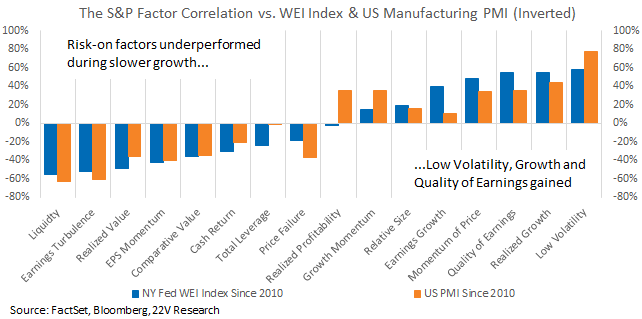
We ran factor return correlations with the NY Fed Weekly Economic Index, a high-frequency coincident indicator of demand. We also looked at correlations with the US Manufacturing PMI, a lower-frequency leading indicator. Both sets of correlations show similar trends and favor Low Volatility, Realized Growth, and Quality of Earnings during periods of slowing economic activity.
Chart, waterfall chart

Description automatically generated

Sector return correlations support a Defensives stance with Staples, Health Care, and Utilities performing best as growth indicators decline. Deep Cyclicals and the rate-sensitive Financials sectors struggle most. Early Cyclicals correlations are mixed. Further slowing of the WEI is a mild positive for Early Cyclicals, while declining PMIs are a mild negative. At the edges, sector performance relationships with growth a strong and consistent, but for Early Cyclical groups, sector trends are weak and OTHER factors (fundamental and macro) are important.
Chart, timeline, waterfall chart

Description automatically generated

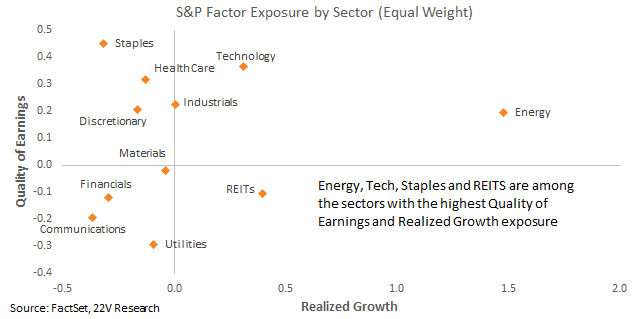
Looking at the current factor exposure of sectors shows Energy, Technology, and Industrials are all positively exposed to Realized Growth and Quality of Earnings. Staples and REITs also have high exposure to either Quality or Realized Growth, which is roughly in line with favored factor and sectors during periods of slowing of growth indicators. Energy, has the greatest exposure to Growth, but that exposure I less important as Energy returns remain highly macro (oil) driven.
Chart

Description automatically generated with medium confidence

At the stock level, we ran return correlations with both the NY Fed Economic Index and US Manufacturing PMI Index. The names with the most negative correlations to both indicators are listed below. The basket is more Defensive, consistent with the highly negative correlations of Defensives to slowing growth.
Table

Description automatically generated

DISCLOSURES AND DISCLAIMERS

Analyst Certification

The analyst, 22V Research Group, primarily responsible for the preparation of this research report attests to the following: (1) that the views and opinions rendered in this research report reflect his or her personal views about the subject companies or issuers; and (2) that no part of the research analyst’s compensation was, is, or will be directly related to the specific recommendations or views in this research report.

Analyst Certifications and Independence of Research.

Each of the 22V Research analysts whose names appear on the front page of this report hereby certify that all the views expressed in this Report accurately reflect our personal views about any and all of the subject securities or issuers and that no part of our compensation was, is, or will be, directly or indirectly, related to the specific recommendations or views of in this Report.

22V Research (the “Company”) is an independent research provider. The Company is not a member of the FINRA or the SIPC and is not a registered broker dealer or investment adviser. 22V Research has no other regulated or unregulated business activities which conflict with its provision of independent research.

22V Research, LLC is a professional services and independent publication organization. 22V Research, LLC is not a securities broker-dealer, not a member of the Financial Industry Regulatory Authority (FINRA), not a registered investment advisor (RIA) and not a member of SIPC.

Securities transactions, when offered, are offered by 22V Securities, LLC through LPS Capital, LLC. Certain employees of 22V Securities, LLC are dually registered as securities representatives of LPS Capital, LLC or Analyst Hub Securities, LLC. 22V Securities, LPS Capital and Analyst Hub Securities are members FINRA, SIPC.

https://brokercheck.finra.org/

Current Ratings Definition.

SECTOR OUTPERFORM: An “outperform” rating anticipates the company will outperform the S&P Regional Banking Index (peer group).

SECTOR PERFORM: A “market perform” rating anticipates the company will perform in line with the S&P Regional Banking Index (peer group).

SECTOR UNDERPERFORM: An “underperform” rating anticipates the company will underperform the S&P Regional Banking Index (peer group).

Limitation Of Research And Information.

This Report has been prepared for distribution to only qualified institutional or professional clients of 22V Research Group. The contents of this Report represent the views, opinions, and analyses of its authors. The information contained herein does not constitute financial, legal, tax or any other advice. All third-party data presented herein were obtained from publicly available sources which are believed to be reliable; however, the Company makes no warranty, express or implied, concerning the accuracy or completeness of such information. In no event shall the Company be responsible or liable for the correctness of, or update to, any such material or for any damage or lost opportunities resulting from use of this data. Nothing contained in this Report or any distribution by the Company should be construed as any offer to sell, or any solicitation of an offer to buy, any security or investment. Any research or other material received should not be construed as individualized investment advice. Investment decisions should be made as part of an overall portfolio strategy and you should consult with a professional financial advisor, legal and tax advisor prior to making any investment decision. 22V Research Group shall not be liable for any direct or indirect, incidental or consequential loss or damage (including loss of profits, revenue or goodwill) arising from any investment decisions based on information or research obtained from 22V Research Group.

Reproduction And Distribution Strictly Prohibited.

No user of this Report may reproduce, modify, copy, distribute, sell, resell, transmit, transfer, license, assign or publish the Report itself or any information contained therein. Notwithstanding the foregoing, clients with access to working models are permitted to alter or modify the information contained therein, provided that it is solely for such client’s own use. This Report is not intended to be available or distributed for any purpose that would be deemed unlawful or otherwise prohibited by any local, state, national or international laws or regulations or would otherwise subject the Company to registration or regulation of any kind within such jurisdiction.

Copyrights, Trademarks, Intellectual Property.

22V Research Group, and any logos or marks included in this Report are proprietary materials. The use of such terms and logos and marks without the express written consent of 22V Research Group is strictly prohibited. The copyright in the pages or in the screens of the Report, and in the information and material therein, is proprietary material owned by 22V Research Group unless otherwise indicated. The unauthorized use of any material on this Report may violate numerous statutes, regulations and laws, including, but not limited to, copyright, trademark, trade secret or patent laws.
