Back Quantitative

Quant Market Diagnostics: Supply Chain Easing Supporting Negative Sentiment Portfolio

Published on December 2, 2022

Download the PDF Report

By

Dennis DeBusschere

Brian Herlihy

Sophia Wang

Kevin Brocks

Supply chain bottlenecks caused by COVID have clearly eased, and signs China is pivoting away from its zero-COVID policy helps that narrative. Daily news sentiment towards supply chains has rebound from its historical low and daily news mentions are dropping too, reducing its headline risk to markets. The NY Fed Global Supply Chain Pressure index also dropped sharply and is back to early-2020 levels.

To profit from the easing of supply bottlenecks, we construct the negative supply chain sentiment basket, which consists of the S&P names that expressed negatively on supply chain issue during their latest earnings calls, rebalancing quarterly. The names are more likely to be impacted by supply chain disruptions and shipping costs and as a result their stocks should benefit most from easing.

Our supply chain portfolio returns have been negatively correlated with freight prices and the NY Fed Supply Chain Pressure Index (SCPI). Though a good deal of easing has taken place, both freight costs and the NY SCPI remain above pre-COVID levels and have further to fall. The scope of gains to our portfolio has certainly narrowed, but supply chain sentiment has proven to be a good screening tool over the past quarter and should remain so until freight rates normalize.

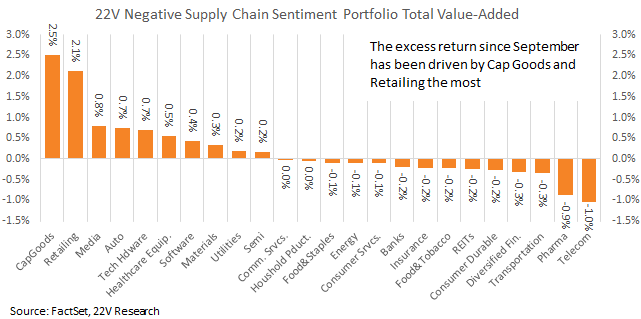
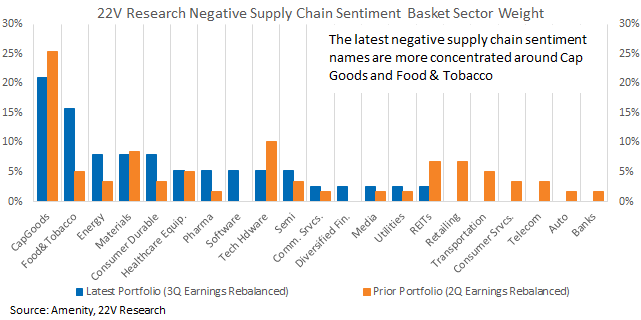
As supply chain issue easing, less names are mentioning supply chain negatively, leading to the names falling in the basket drops to 38 relative to previous 59 names. We list the current basket at the end of the report. Excess returns to the portfolio since September has been driven most by Cap Goods and Retailing. The portfolio is overweight Cap Goods and Retailing and names from both industry groups have outperformed. After we rebalanced the portfolio, incorporating 3Q sentiment readings, the portfolio is less weighted to Cap Goods and more weighting on Food & Tobacco and Energy.

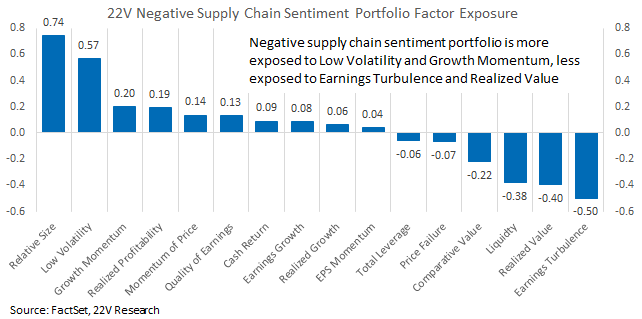
The factor exposure of rebalanced negative supply chain is more risk-off exposed. Though the easing of financial conditions is a macro headwind to risk-off factors, the outperformance of the portfolio suggests that fundamental recovery from supply chain easing is adding more than the factor profile is taking away.

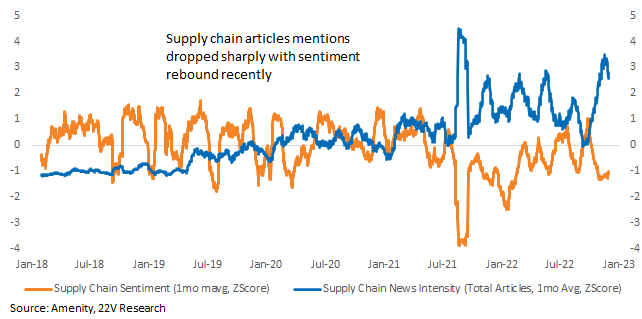
Supply Chain Easing Supporting Negative Sentiment Portfolio: Supply chain bottlenecks caused by COVID have clearly eased, and indications China is pivoting away from its zero-COVID policy helps that narrative. Daily news sentiment towards supply chains has rebound from its historical low and daily mentions are dropping too, reducing its headline risk to markets. The NY Fed Global Supply Chain Pressure index also dropped sharply and is back to early-2020 levels. Easing supply chain pressures are alleviating goods price inflation pressure as well.
Graphical user interface

Description automatically generated with low confidence

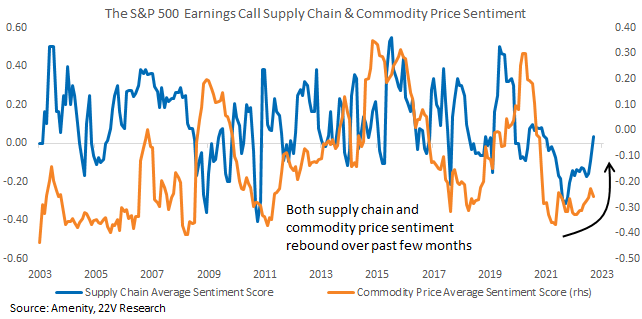
Companies are feeling less the pressure from supply chain issue today as well. Supply chain sentiment of S&P managers expressed during 3Q earnings, which we measure using the Amenity natural language processing tool (if you want to learn more about the tool just let me know) rebounded sharply and it again net positive. Another driver for inflation, commodity prices, have also dropped, and the sentiment toward commodity prices is well off its low.
Chart, line chart

Description automatically generated

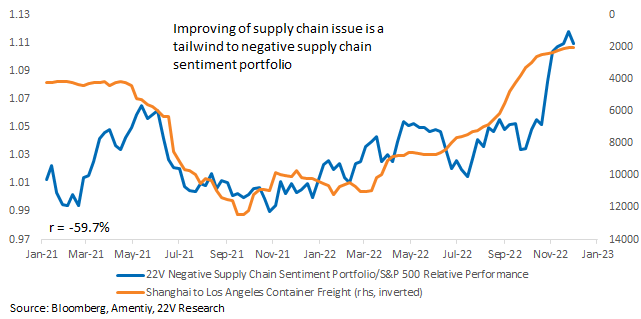
To profit from the easing of supply bottlenecks, we construct the negative supply chain sentiment basket, which consists of the S&P names that expressed negatively on supply chain issue during their latest earnings calls, rebalancing quarterly. The names are more likely to be impacted by supply chain disruptions and shipping costs and as a result their stocks should benefit most from easing. The indexed performance of the portfolio has been negatively correlated with freight prices over time. Freight prices have come down but remain about their pre-COVID level and NY Fed Global Chain Pressure Index remains near its 90th percentile, leaving room for negative supply chain names to post further gains, though at a lesser extent.
Chart

Description automatically generated

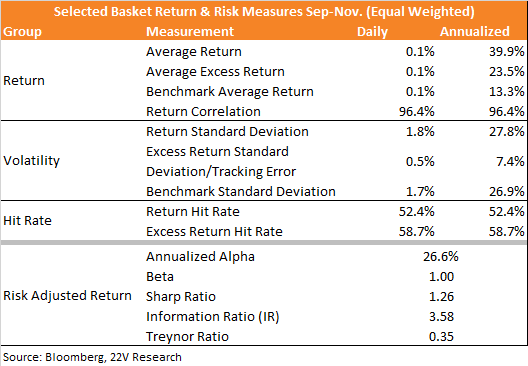
Over the past 3 months, the portfolio gained 23.5% annualized excess return relative to the S&P, posting gains on 58.7% of days. The beta has been roughly in line with the S&P with a sharp ratio of 1.26.
Table

Description automatically generated

The excess return for the previous quarterly basket has been driven by Cap Goods and Retailing names. Telecom and Pharma were drags on the portfolio. The basket remains VERY overweight Cap Goods and Retailing, and names in the portfolio from both industry groups outperformed. These are industries more likely to be impacted by supply chain issue as well.
Chart, waterfall chart

Description automatically generated

We rebalance the portfolio based on 3Q earnings call sentiment readings. As supply chain issue ease, fewer companies are mentioning supply chain negatively, leading to fewer names falling into the negative basket. Total positions dropped from 38 relative to 59 names in the 2Q basket. The decline in stocks also means more concentrated sector/industry exposure. The rebalanced portfolio is less weighted to Cap Goods while is more weighting on Food & Tobacco and Energy.
A screenshot of a computer

Description automatically generated with medium confidence

The factor exposure of the rebalanced negative supply chain portfolio is MUCH more risk-off with Relative Size, Low Volatility, and Growth Momentum the leading factors. The portfolio is negatively exposed to Earnings Turbulence, Realized Value, and Liquidity factors. Easing of financial conditions is a macro headwind to risk-off factors, but the outperformance of the portfolio suggests screening for leverage to easing supply bottlenecks is overpowering that factor drag.
A picture containing timeline

Description automatically generated

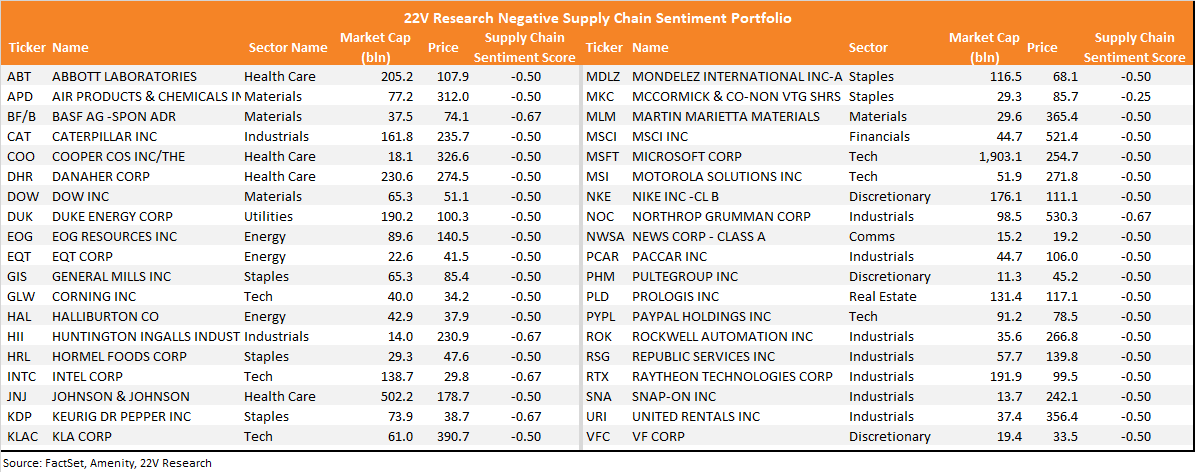
Below we list the companies expressing the most negativity about supply chains in their latest 3Q earnings calls, and currently falling into the negative supply chain portfolio. They should recover more as supply chain bottlenecks continue to improve.
Graphical user interface, application

Description automatically generated

DISCLOSURES AND DISCLAIMERS

Analyst Certification

The analyst, 22V Research Group, primarily responsible for the preparation of this research report attests to the following: (1) that the views and opinions rendered in this research report reflect his or her personal views about the subject companies or issuers; and (2) that no part of the research analyst’s compensation was, is, or will be directly related to the specific recommendations or views in this research report.

Analyst Certifications and Independence of Research.

Each of the 22V Research analysts whose names appear on the front page of this report hereby certify that all the views expressed in this Report accurately reflect our personal views about any and all of the subject securities or issuers and that no part of our compensation was, is, or will be, directly or indirectly, related to the specific recommendations or views of in this Report.

22V Research (the “Company”) is an independent research provider. The Company is not a member of the FINRA or the SIPC and is not a registered broker dealer or investment adviser. 22V Research has no other regulated or unregulated business activities which conflict with its provision of independent research.

22V Research, LLC is a professional services and independent publication organization. 22V Research, LLC is not a securities broker-dealer, not a member of the Financial Industry Regulatory Authority (FINRA), not a registered investment advisor (RIA) and not a member of SIPC.

Securities transactions, when offered, are offered by 22V Securities, LLC through LPS Capital, LLC. Certain employees of 22V Securities, LLC are dually registered as securities representatives of LPS Capital, LLC or Analyst Hub Securities, LLC. 22V Securities, LPS Capital and Analyst Hub Securities are members FINRA, SIPC.

https://brokercheck.finra.org/

Current Ratings Definition.

SECTOR OUTPERFORM: An “outperform” rating anticipates the company will outperform the S&P Regional Banking Index (peer group).

SECTOR PERFORM: A “market perform” rating anticipates the company will perform in line with the S&P Regional Banking Index (peer group).

SECTOR UNDERPERFORM: An “underperform” rating anticipates the company will underperform the S&P Regional Banking Index (peer group).

Limitation Of Research And Information.

This Report has been prepared for distribution to only qualified institutional or professional clients of 22V Research Group. The contents of this Report represent the views, opinions, and analyses of its authors. The information contained herein does not constitute financial, legal, tax or any other advice. All third-party data presented herein were obtained from publicly available sources which are believed to be reliable; however, the Company makes no warranty, express or implied, concerning the accuracy or completeness of such information. In no event shall the Company be responsible or liable for the correctness of, or update to, any such material or for any damage or lost opportunities resulting from use of this data. Nothing contained in this Report or any distribution by the Company should be construed as any offer to sell, or any solicitation of an offer to buy, any security or investment. Any research or other material received should not be construed as individualized investment advice. Investment decisions should be made as part of an overall portfolio strategy and you should consult with a professional financial advisor, legal and tax advisor prior to making any investment decision. 22V Research Group shall not be liable for any direct or indirect, incidental or consequential loss or damage (including loss of profits, revenue or goodwill) arising from any investment decisions based on information or research obtained from 22V Research Group.

Reproduction And Distribution Strictly Prohibited.

No user of this Report may reproduce, modify, copy, distribute, sell, resell, transmit, transfer, license, assign or publish the Report itself or any information contained therein. Notwithstanding the foregoing, clients with access to working models are permitted to alter or modify the information contained therein, provided that it is solely for such client’s own use. This Report is not intended to be available or distributed for any purpose that would be deemed unlawful or otherwise prohibited by any local, state, national or international laws or regulations or would otherwise subject the Company to registration or regulation of any kind within such jurisdiction.

Copyrights, Trademarks, Intellectual Property.

22V Research Group, and any logos or marks included in this Report are proprietary materials. The use of such terms and logos and marks without the express written consent of 22V Research Group is strictly prohibited. The copyright in the pages or in the screens of the Report, and in the information and material therein, is proprietary material owned by 22V Research Group unless otherwise indicated. The unauthorized use of any material on this Report may violate numerous statutes, regulations and laws, including, but not limited to, copyright, trademark, trade secret or patent laws.
