Investors are focusing on the FOMC meeting today and the futures market indicates a 75bp hike is most widely expected, consistent with the Strategy teams FOMC survey yesterday (details here). Whether the Fed can rein inflation without forcing a deep decline in economic activity remains unknown, but the forward path of risk assets and market internals is heavily dependent on the path of growth..
In general, implied volatility has been modestly influenced by FOMC rate hike meetings. Since 1990, the VIX has been lower 1 day after the FOMC and that trend usually continues for ~3 months, but the influence is minor. Equity implied volatility has behaved differently this year, falling INTO the FOMC hikes, increasing immediately after and then declining. Some of that is a result of the unusually high level of implied vol, and some is caused by the high level of policy uncertainty. Both those conditions remain present today.

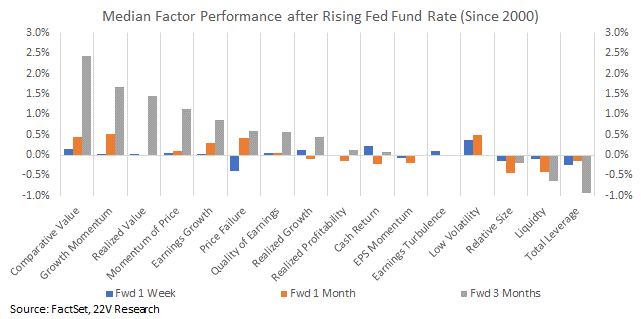
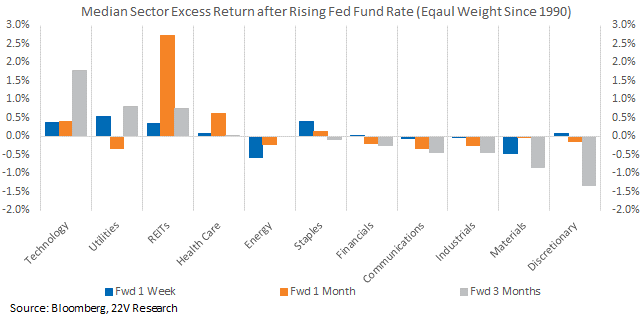
Risk rotations following rate hikes tend to be risk-off. Low Volatility was one of the best performing factors short-term after rate hikes. Defensive sectors, which tend to be more exposed to Low Volatility, outperformed after rate hikes at the expense of Deep Cyclicals such as Energy and Materials. In the months following rate hikes, Comparative Value and Growth Momentum retook leadership.
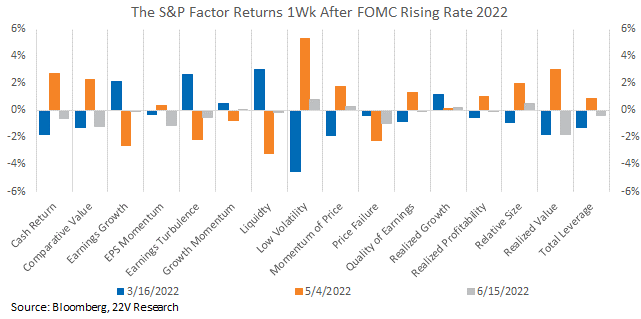
Factor performances have been more volatile around the Fed rate hikes. Following the historical pattern, Low Volatility gained following the most recent rate hikes but fell in March. That volatility has been in line with factor return mean reversal this year. It suggests that direct impact from rising fed fund rate on factor performance is limited while factor returns are more dependent on higher frequency data like rate hike expectations, inflation readings, etc., Internal volatility will likely be continued until the growth path becomes clearer.
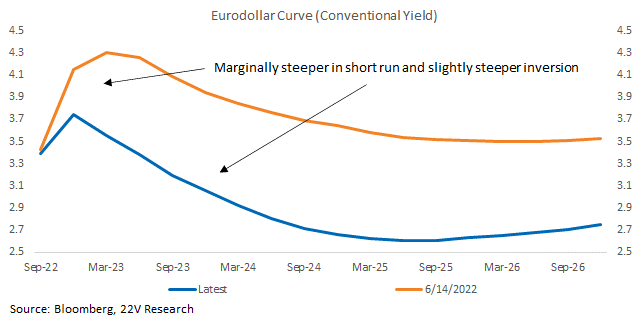
Market Volatility and Fed Decision: Investors are focusing on the FOMC meeting today and the futures market indicates a 75bp hike is most widely expected, consistent with the Strategy teams FOMC survey yesterday (details here). As growth slows, oil prices drop, and supply chain issues eased, long-term inflation expectation have moved back below 3%, and the Eurodollar curve has declined, suggesting easing of policy risk.
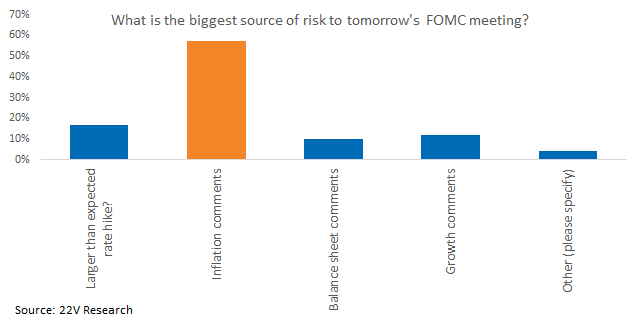
Concerns about inflation remain the biggest source of concern for investors. Yesterday’s flash survey showed that investors expect inflation comments to be the biggest source of risk from the FOMC meeting. Whether the Fed can rein inflation without forcing a deep decline in economic activity remains unknown, but the forward path of risk assets and market internals is heavily dependent on the path of growth.
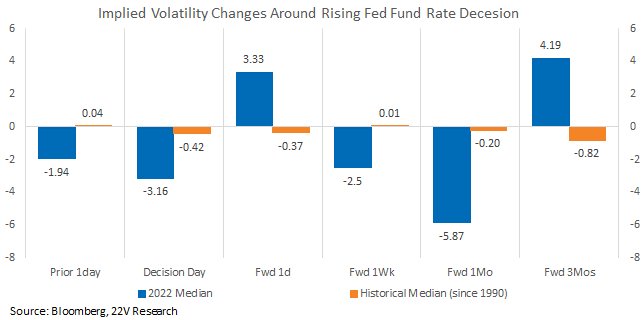
In general, implied volatility has been modestly influenced by FOMC rate hike meetings. Since 1990, the VIX has been lower 1 day after the FOMC and that trend usually continues for ~3 months, but the influence is minor. Equity implied volatility has behaved differently this year, falling INTO the FOMC hikes, increasing immediately after and then declining. Some of that is a result of the unusually high level of implied vol, and some is caused by the high level of policy uncertainty. Both those conditions remain present today.
Factor returns around rate hikes reflected a general, short-term de-risking. Low Volatility was one of the best performing factors 1 week and 1 month after rate hikes Relative Size and Liquidity fell. Longer term Comparative Value and Growth Momentum gained the most and risk factor returns eased.
At the sector level, Defensives, which tend to be more exposed to Low Volatility, outperformed following rate hikes at the expense of Deep Cyclicals such as Energy and Materials. Longer-term the outperformance of Defensives and underperformance of Deep Cyclicals continued while Technology gained.
In line with higher volatility this year, short-term factor returns 1 week following the past three FOMC meetings were mixed. Low Volatility gain the most after the latest rate hike but underperformed in March. Though the rate hike may influence factor trends on the day of the announcement, a 75bp hike is well discounted by investors. Barring a surprise (50 or 100bp), changes in real rates and inflation should remain the macro forces most influencing factors.
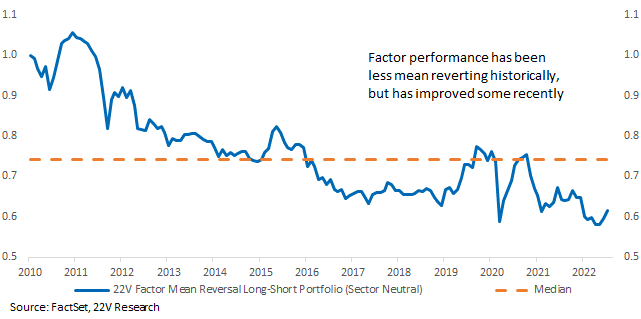
Increasing mean reversal helps explain the rotation of factor returns following recent rate hikes. A simple factor mean reversal strategy rebalancing monthly has perform poorly this year but has rebounded sharply over the past few months. That suggests higher frequency data like changes to fed rate expectations and inflation readings are having a greater influence. Near term the rotation will likely be continued until there is a clearer path for growth.