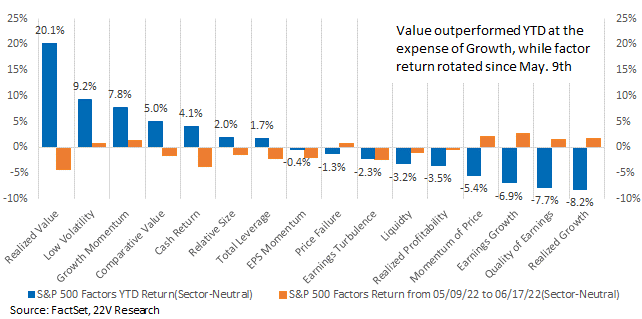
As overall market volatility has increased this year, so has factor return volatility. There have been multiple risk-on/risk-off and style (Value vs. Growth) rotations in the first half of 2022. So far this year Realized Value has been the best performing factor, gaining 20.1% in a market that is down -21.5%. Realized Growth has been the worst performing factor falling -8.2%.
Energy has significantly outperformed all other sectors and was a high Value sector at the start of the year, and Technology has been one of the worst sectors and is highly Growth exposed. BUT, the outperformance of Value and the underperformance of Growth has been a much broader theme. Indexed performance of Realized Value and Realized Growth barely changes if we exclude Energy names from Value and Tech names from Growth.
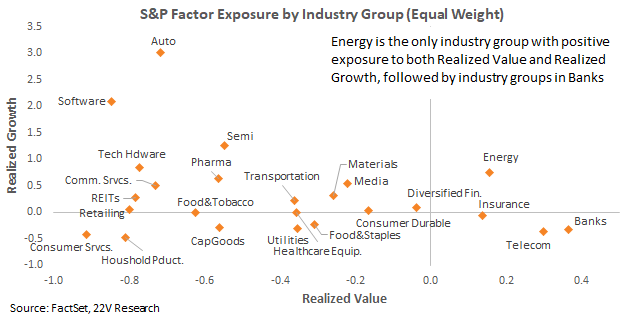
Hit rates of Realize Value and Realized Growth screening across many industry groups have been clustered this year. Part of the reason is that dispersion between Value and Growth has narrowed with the rank correlation between Realized Value and Realized Growth now slightly positive, one of its highest levels historically. Energy has been the only industry group positively exposed to both factors while some of industry groups more consumer oriented currently are negatively exposed to both Growth and Value, including Household Products, Consumer Services, Food & Staples, Cap Goods and Utilities.
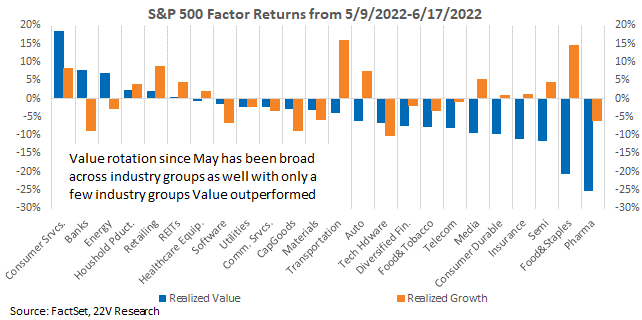
Since early-May a long-short Realized Value portfolio has declined across most industry groups. Growth screening has generated positive returns across roughly half of industry groups. With implied equity volatility very high and recession risk a concern, expect more factor rotations ahead. Though risk-on/off screening is likely to generate greater returns, near term there should be some recovery from Growth names.
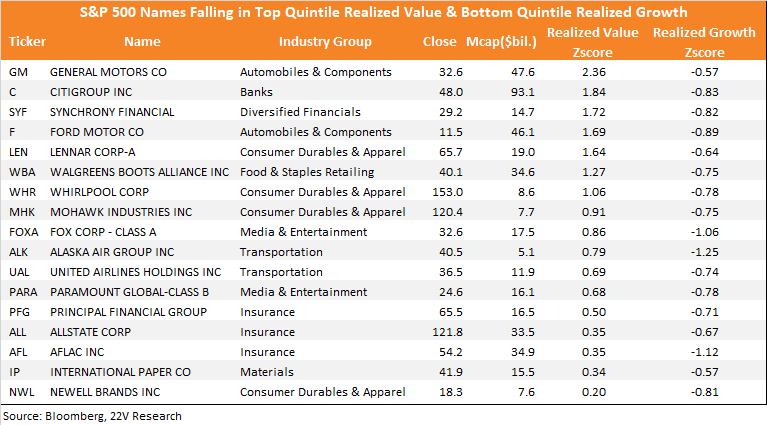
At the end of this report we offer two lists. The first is Value names that are NOT Growth and the second are Growth names that are NOT Value. These are stocks we would focus on when thinking about positioning for style rotations.
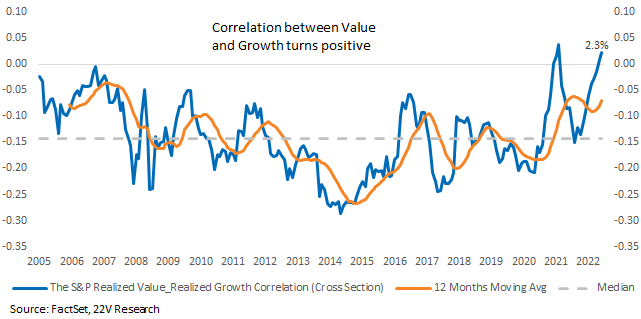
Today the dispersion between Value and Growth has narrowed and the cross-section correlation between Realized Value and Realized Growth turns positive. It suggests that more stocks are less influenced by rotation between Value and Growth as they are positively or negatively exposed to both factors.
Value Looks a Lot Like Growth Today: As overall market volatility has increased this year, so has factor return volatility. There have been multiple risk-on/risk-off and style (Value vs. Growth) rotations in the first half of 2022. So far this year Realized Value has been the best performing factor, gaining 20.1% in a market that is down -21.5%. Realized Growth has been the worst performing factor falling -8.2%. Value’s exceptional rally has narrowed the wide performance spread that existed between Value and Growth heading into the end of ’21. Though the market rally that started in early-May has reversed since the start of June, Growth has continued to gain ground on Value names.
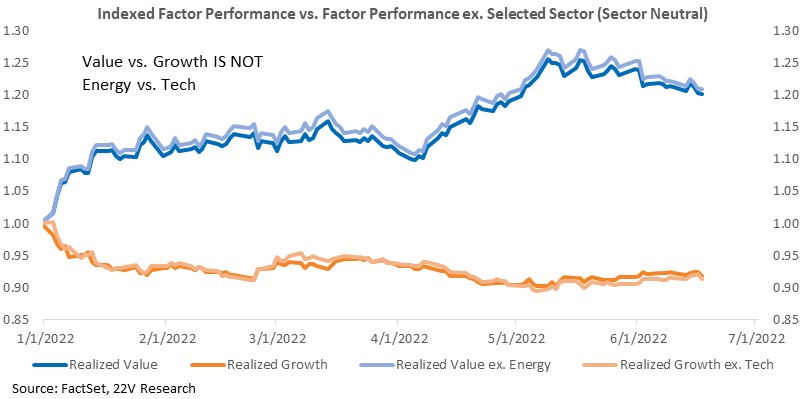
We hear from many people that the Value rally has been a result of Energy’s tremendous gains this year, and that Growth has faltered because of Tech’s losses. Energy has significantly outperformed all other sectors and was a high Value sector at the start of the year, and Technology has been one of the worst sectors and is highly Growth exposed. BUT, the outperformance of Value and the underperformance of Growth is a much broader theme. Indexed performance of Realized Value and Realized Growth barely changes if we exclude Energy names from Value and Tech names from Growth.
High Realize Value Energy stocks have performed well, but with only a slightly better than 50% hit rate (about 55% of high Value Energy names have outperformed). Realized Value has generated the best returns within the defensive Healthcare Equipment and Household Products spaces, and the cyclical Software and Materials industry groups.
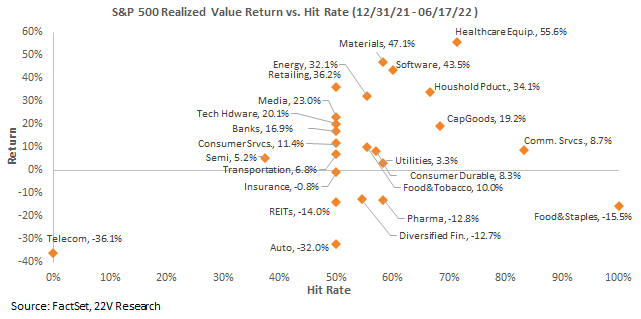
And keep in mind that Telecom, which has had the WORST returns to Value factors this year, is the second best performing Industry group (S&P 500, eq weighted). The best performing factor within Telecom has been Growth, which has a near 100% hit rate. Rarely is a market purely Value or Growth, and what works where is a combination of factor tailwinds and industry group dynamics (correlation, rate sensitivity, inflation sensitivity, growth expectations, etc.)
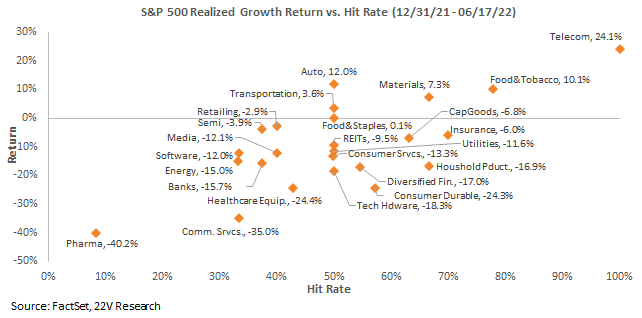
On Value vs Growth Screening Going Forward: Hit rates of Realize Value and Realized Growth screening across many industry groups have been clustered this year. Part of the reason is that dispersion between Value and Growth has narrowed with the rank correlation between Realized Value and Realized Growth now slightly positive, one of its highest levels historically. Keep in mind that the correlation is still near zero, so all Value is not Growth. But broad baskets of the two factors will have much more crossover than normal. That suggests stocks are less influenced by rotations between Value and Growth today.

As oil prices rebound with the global economic reopening, Energy company earnings picked up quicky and the industry group has become more positively exposed to both Realized Growth and Realize Value. On the other side of the ledger, some groups are negatively exposed to both Growth and Value, including Household Products, Consumer Services, Food & Staples, Cap Goods, and Utilities.
Value factors reached their peak on May 9th and have been declining since then. A long-short Realized Value portfolio has declined across most industry groups since. Realized Growth has rebounded to some extent, with returns to Growth screening positive across roughly half of industry groups. With implied equity volatility very high and recession risk a concern, expect more factor rotations ahead. Though risk-on/off screening is likely to generate greater returns, near term there should be some recovery from Growth names.
Given the increased correlation between Value and Growth, it becomes more important to separate the factors at the stock level. Below we list the S&P names that are highly exposed to Realized Value that also have low Growth exposure. These names are more pure Value names and should benefit the most from Value outperformance.
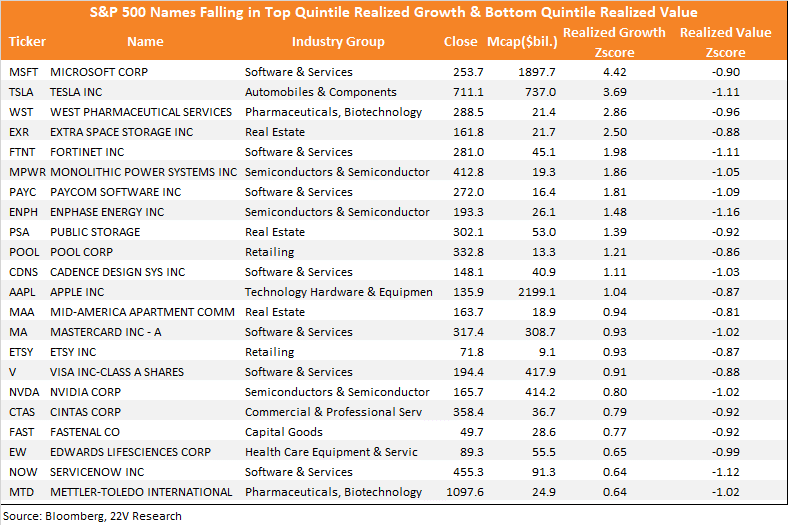
Below are the names with high Realized Growth exposure and low Realized Value exposure, and should benefit the most during Growth recovery.