Thanks to everyone who responded to our survey. These are meant to create a quick measure of sentiment on important, topical questions. Please hit us back with feedback – our goal is to help, after all.
Quick summary, most investors think:
-Fed Funds will peak around 2.75%, well below market-based expectations of ~3.3%
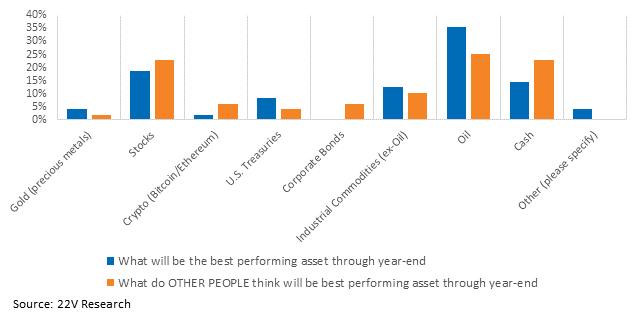
-Oil (35% of respondents) will be the best-performing asset class YTD (stocks and cash were the runners-up)
-Respondents think OTHER investors favor oil (25%) as well (Cash and Stocks were again the runners-up)
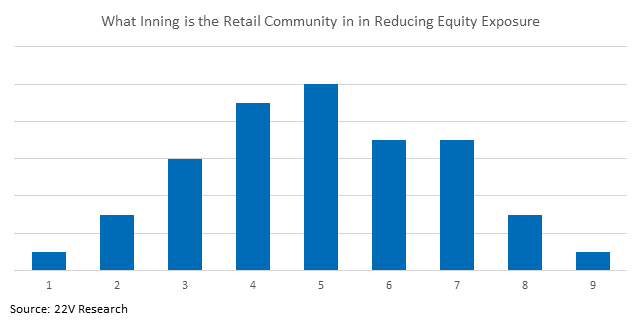
-Retail investors are about halfway through reducing equity exposure.
On to the results.
Peak Fed Funds: The median respondent thinks the Fed Funds rate will peak at 2.75%, or 7 +25bp increments from here. Current futures pricing and signaling by FOMC speakers (clearly both of those are data-dependent) indicate 50bp hikes at the next two meetings followed by three 25bp hikes. Following that rate path, the average respondent to our survey expects the rate hike cycle to be over by the end of the year.
That result suggests a near-term 75bp rate hike would be a shock. It also indicates investors expect that Fed will signal that the rate hike cycle is nearing an end around the September FOMC meeting. A 25 rate hike could be a positive catalyst.

Currently, the Eurodollar futures curve indicates a peak fund rate of 3.3% in June of next year. That’s 2 more +25bp increments than our respondents expect.
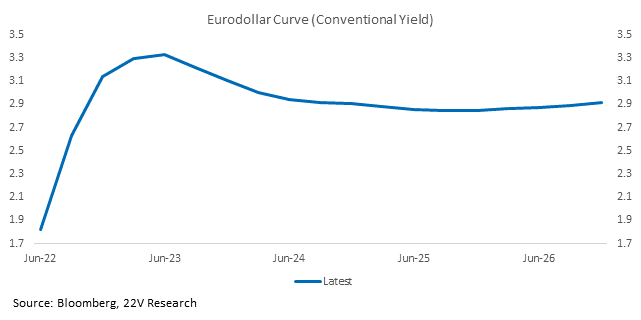
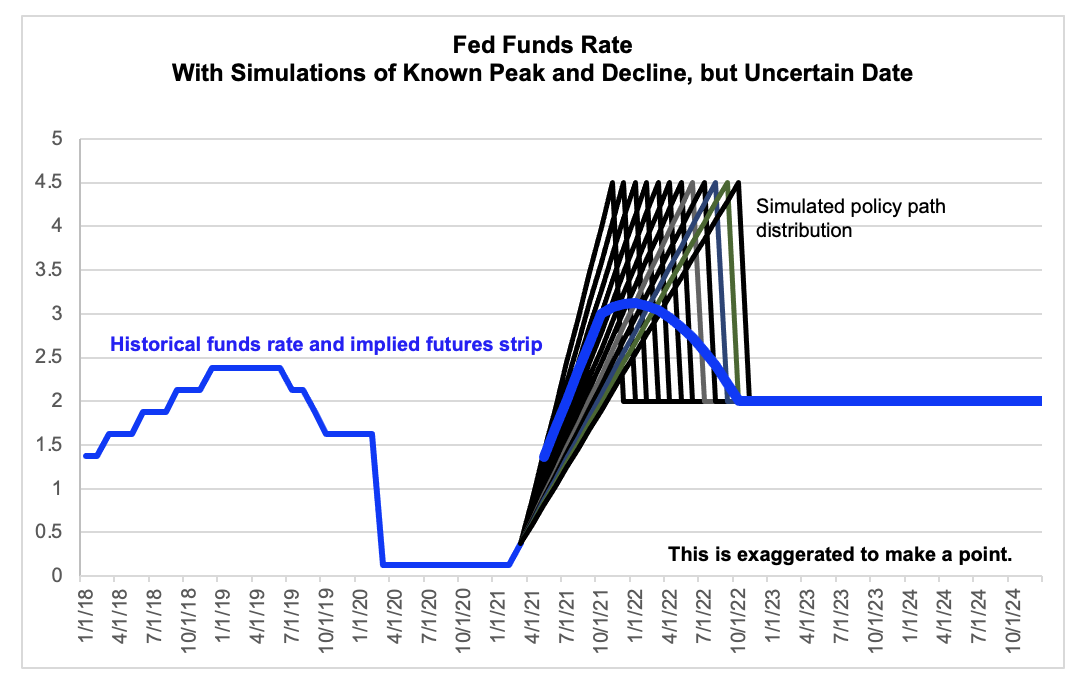
As Gerard has pointed out recently, the peak Fed Funds rate is understated by futures markets because we don’t know the date of the peak. The investors we polled are likely even further below market-based expectations than the Eurodollar curve indicates.
Best Asset Class to Year-End: A plurality of our respondents (35%) expect oil to be the best performing asset, following by stocks (19%), cash (15%), and then industrial commodities (13%). Respondents think other people expect oil (25%), stocks (23%) and cash (also 23%) to perform best. In other words, most people expect oil to be the best performing but underestimate how many OTHER people believe the same thing. Our wording of the question may have introduced some ambiguity. The goal was to figure out what investors expect to be the best performing asset FROM HERE through year-end. We will be more precise going forward.
State of the Retail Selloff: Investors think retail investors are about halfway through reducing equity exposure. Investors expect retail selling pressures to continue.
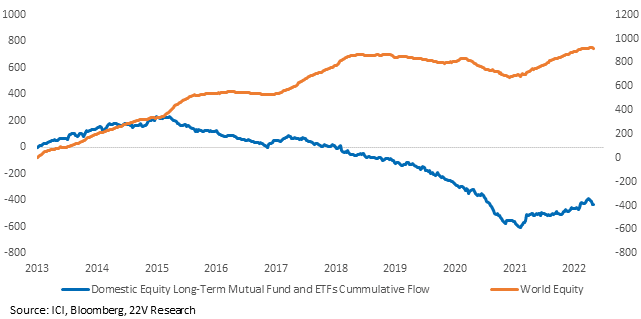
For what it is worth, domestic cumulative fund flows have dropped but have been negative since 2018. We get fund flows data from ICI (here). The cumulative number is the rolling aggregate of the weekly net flows.