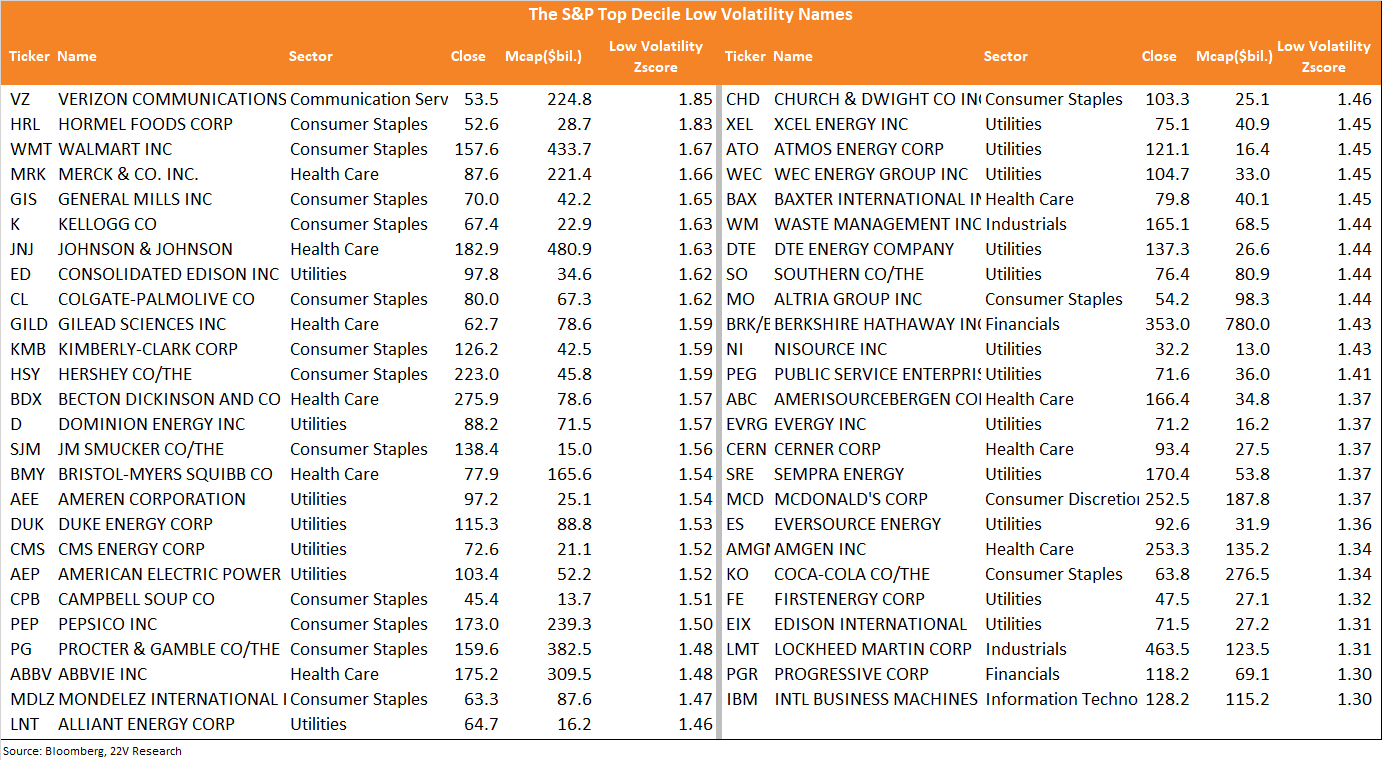
Market volatility has ratcheted higher in 2022; the VIX has typically been around 24, more than 5 points above its 2021 median of 18.6. Uncertainty tied to inflation, central bank tightening, and the war have all contributed to increased volatility. Stock correlations have trended higher as well. Earnings season typically causes a downturn in short-term correlations, but the macro backdrop suggests investors should prepare for unstable correlations.
In-line with elevated implied volatility and correlations, factor return dispersion has increased this year. Rolling 6-month factor return dispersion has increased to just below recession levels. Factor leadership has changed hands multiple times as shocks have led to tighter financial conditions and sentiment shifts have led to easing financial conditions. Those rapid shifts and the high level of return dispersion have made factor trend following difficult.

During periods of elevated volatility, factor returns tend to be skewed toward low-risk groups. Quality of Earnings and Low Volatility has the highest positive correlation with both factor return dispersion and implied volatility, while Earnings Turbulence and Liquidity are the most negatively correlated. Factor relationships with dispersion are consistent with their correlations to financial conditions. In periods of increased uncertainty, investors tend to favor Quality and low Vol.
Short-term, the outperformance of Low Volatility is extreme (97th percentile historically). The WoW performance of Quality of Earnings is around its 87th percentile. Given those gains and the high level of overall factor dispersion, some give short-term giveback seems reasonable. However, Low Volatility and Quality of Earnings remain attractive medium-term factors because financial conditions still need to tighten further to slow growth, volatility remains elevated, and earnings reporting season is getting underway.
Elevated Factor Volatility: Market volatility has ratcheted higher in 2022. The VIX has typically been around 24 YTD, more than 5 points above its 2021 median of 18.6. Uncertainty tied to inflation, central bank tightening, and the war have all contributed to increased volatility. Stock correlations have trended higher as well. Earnings season typically causes a downturn in short-term correlations, but the macro backdrop suggests investors should prepare for unstable correlations.
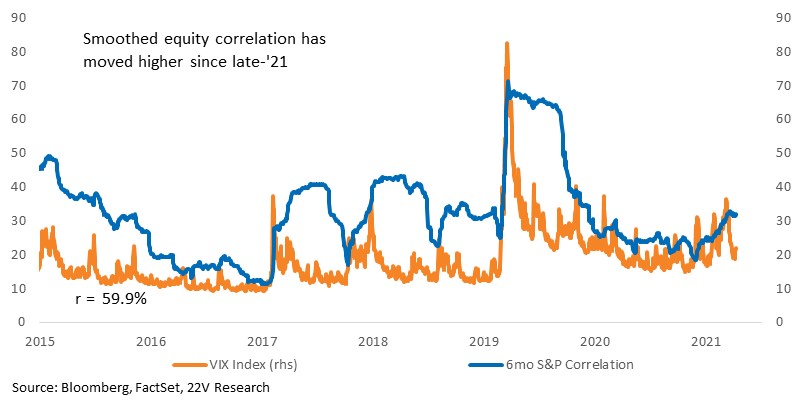
In-line with elevated implied volatility and correlations, factor return dispersion has increased this year. Rolling 6-month factor return dispersion has risen to just below recession levels. Factor leadership has changed hands multiple times as shocks have led to tighter financial conditions and sentiment shifts have led to easing financial conditions. Those rapid shifts and the high level of return dispersion has made factor trend following hard.
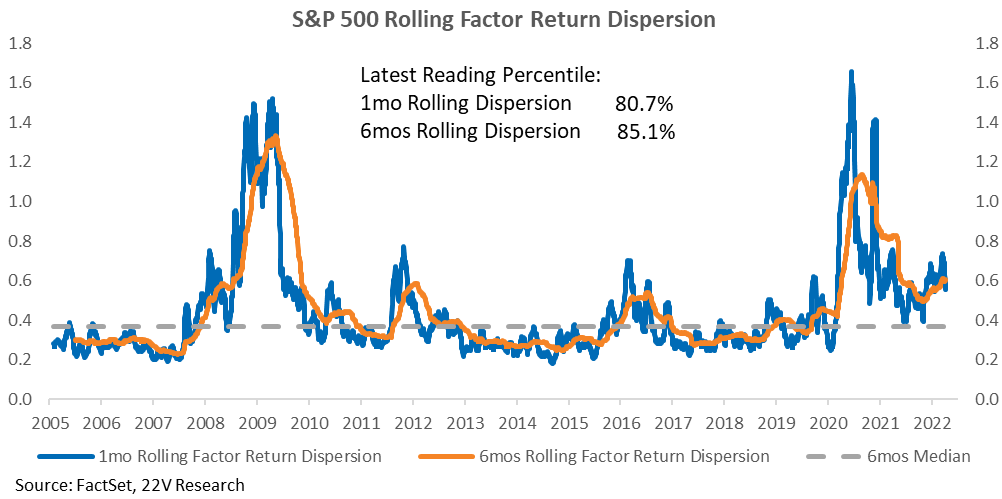
During periods of elevated volatility, factor returns tend to be skewed toward low-risk groups. Quality of Earnings and Low Volatility have the highest positive correlation with both factor return dispersion and implied volatility, while Earnings Turbulence and Liquidity are the most negatively correlated. Factor correlations with dispersion are consistent with the correlations to financial conditions. Put simply, in periods of increased uncertainty, investors tend to favor Quality and low Vol.
Recent factor performance has mapped well to correlations with increased dispersion. Low Volatility was up 4.3% w/w through Thursday’s close while Quality of Earnings, the second-best performer, gained 1.8%. Since the start of the war most factor returns have been mixed/small with the exception of risk factors. Though far from a straight line, Low Vol names have posted the best returns since the war started while Earnings Turbulence and Low Liquidity have fallen.
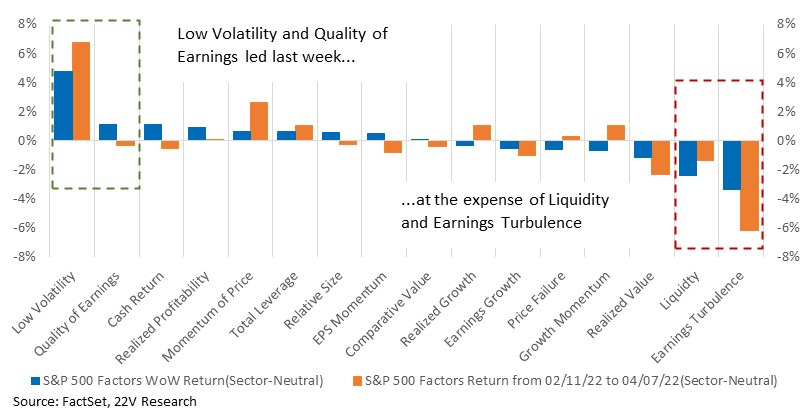
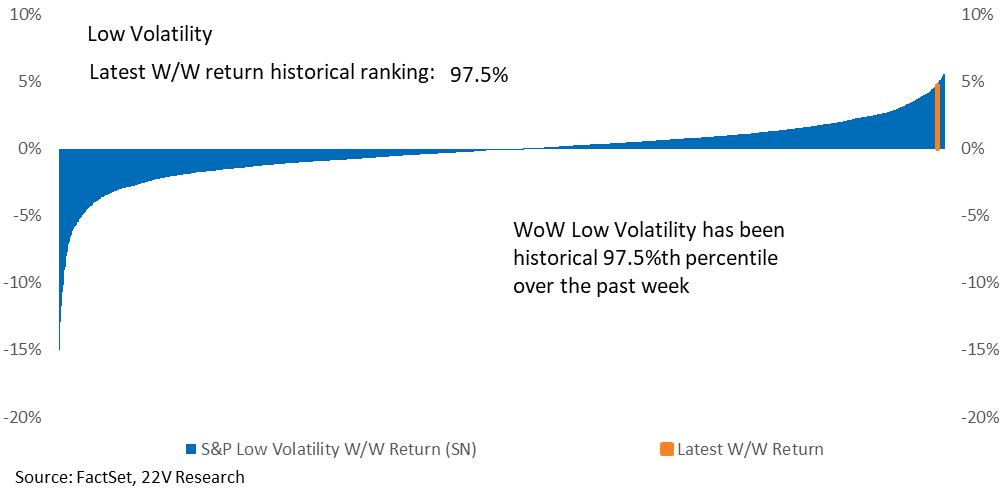
Short-term, the outperformance of Low Volatility is extreme (97th percentile historically). The WoW performance of Quality of Earnings is around its 87th percentile. Given those gains and the high level of overall factor dispersion, some give short-term giveback seems reasonable. However, Low Volatility and Quality of Earnings remain attractive medium-term factors because financial conditions still need to tighten further to slow growth, volatility remains elevated, and earnings reporting season is getting underway.
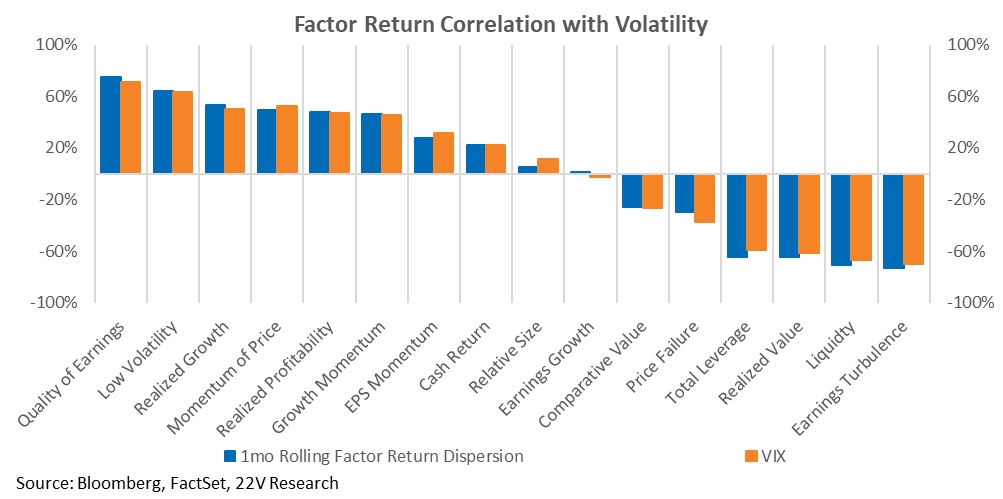
Below we list the S&P names with the highest Low Volatility scores. Those looking for a short-term reversal of factor performance trends can use this as a possible short list. But as we expect financial conditions need to tighten further, pullback in these names would be a reason to consider building/adding to positions.