Back in the dark ages that were the early 1970s, General Mills introduced Hamburger Helper in response to a meat shortage and rising meat prices. The product, which had its own mascot (a four-fingered white gloved hand, “Helper”), was either pasta or rice – along with a packet of seasonings – that was to be combined with cooked ground beef in order to, as my mother used to say, “stretch the meal.” If you are of a certain age or your family was of a certain income (my father was out of work a lot in the 70s), then you will likely remember the product. In my neighborhood you threw your fists if someone said, “You’re so poor your mother cooks with Hamburger Helper.”
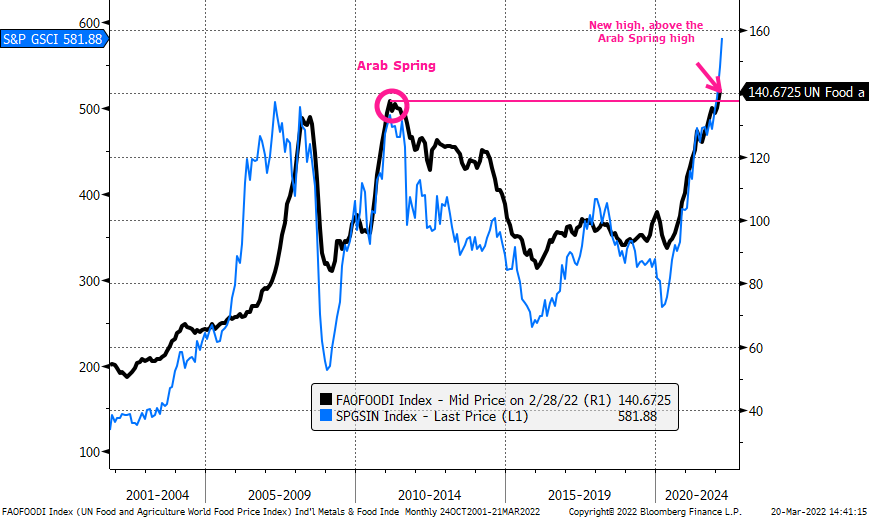
It struck us oddly months ago as the Street, and industry commentators, followed the out-of-touch Fed and Treasury Secretary and went with the mis-guided notion that “inflation would slow in 2022.” We thought then that inflation would be worse in 2022 than 2021. It was an easy call, all you had to do was do your own grocery shopping to have noticed and checked the two series in the following chart showing the S&P GSCI Industrial Metals Index (l, blue) and the UN Food and Agriculture World Food Price Index (r, black). Their relationship isn’t perfect, but you don’t need chart skills to see that both data series trend together. The Industrials Metals Index is up 39% y/y and with data through February the World Food Price Index is up 21% y/y.
Weekend articles, with provocative titles, in Barron’s (“Food Prices Keep Going Up. The Impact May Be Felt Far Beyond the Supermarket”) and on Bloomberg (“Food Security Panics Governments as Ukraine War Blocks Supplies,” “Soaring Prices for Everything Used in Food Brings More Inflation,” “The World’s Biggest Commodities Markets Are Starting to Seize Up,” “Farm Inflation Points to Costlier Grocery Bills,”) should get the attention of everyone who hasn’t been paying attention to this point.
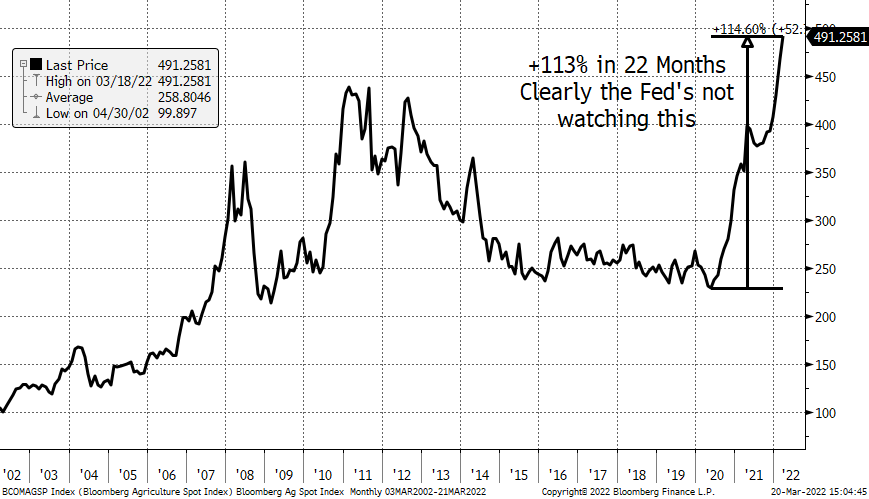
We think, however, that the Fed and other CBers are hamstrung because they can’t print commodities. As the first chart showed above and the following chart shows below, both the UN Food and Agriculture World Food Price Index and the Bloomberg Agriculture Spot Index are clearly above their 2011 Arab Spring highs. Surging food inflation is raising the specter of social instability. For example, Egypt gets 86% of its wheat imports from Russia and Ukraine and it, and other countries, are struggling to secure supplies right now. If a warning issued by another Bloomberg article pans out – “Flood Risk Threatens to Delay Wheat Sowing in Dakotas, Minnesota” – we shouldn’t be surprised if an “American Autumn” comes to pass.
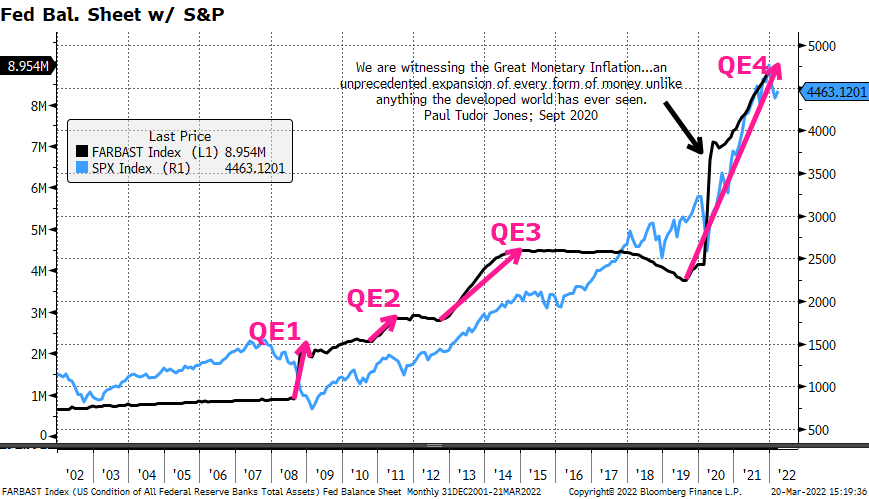
Two other articles were especially timely and helpful. In a Bloomberg opinion piece entitled, “Has the Fed Given Up the Inflation Fight?” Narayana Kocherlakota, former Minneapolis Fed President said, “Why is the Fed not getting tougher on inflation? The answer seems to be that it thinks its monetary policy tools won’t have the desired effect. As Chair Jerome Powell noted in his last pre-Covid news conference, the relationship between macroeconomic slack and inflation has become very weak. In other words, the Fed doesn’t think it will get much traction on inflation if it turns the economy toward slower growth. Still, this doesn’t explain why it’s actively turning in the wrong direction — the kind of mistake many a driver has made when hitting a patch of ice.” To put some figures on Kocherlakota’s analogy, consider that though the Fed has “ended” QE they increased their Bal. Sheet last week by $43B.
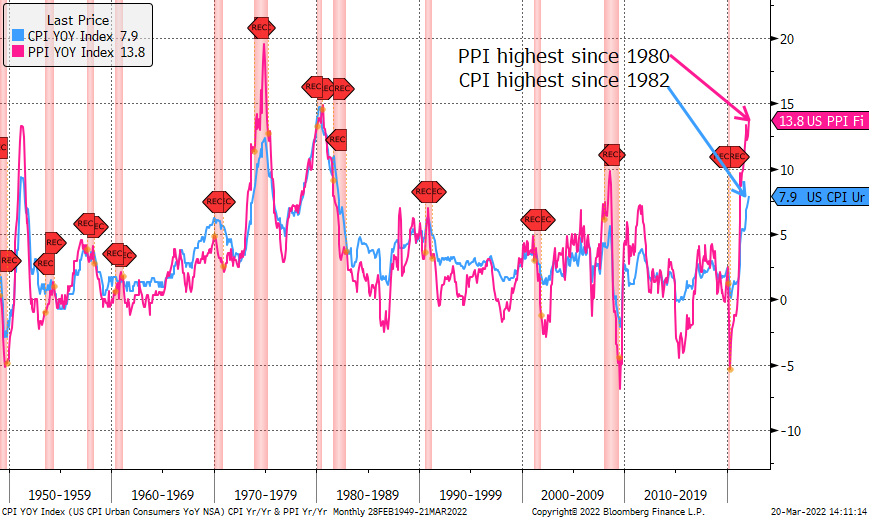
Lastly, Mohamed El-Erian said in his Project Syndicate column, “The Fed’s Historic Era,” that “The Fed’s suboptimal decisions over the past 12 months mean that its next policy decision also is likely to be suboptimal. Even if it had a good feel for the current “first best” policy response, the Fed is unlikely to be able to implement it, given how far policymakers have fallen behind economic realities.” How far behind are they? The CPI and PPI are both higher today than when General Mills introduced Hamburger Helper in 1971.
The S&P has bounced sharply, +7% in four days and + 8 ½% in 16 days, and so has NASDAQ, +10.7% in four days and + 10.4% in 16 days, where the S&P is now touching its 200-day moving average though NASDAQ is still 6% below its 200-day moving average. We still think both indexes are better sales here, than they are buys, and we still favor commodities and commodity-related equities, and we continue to believe rates will march higher.
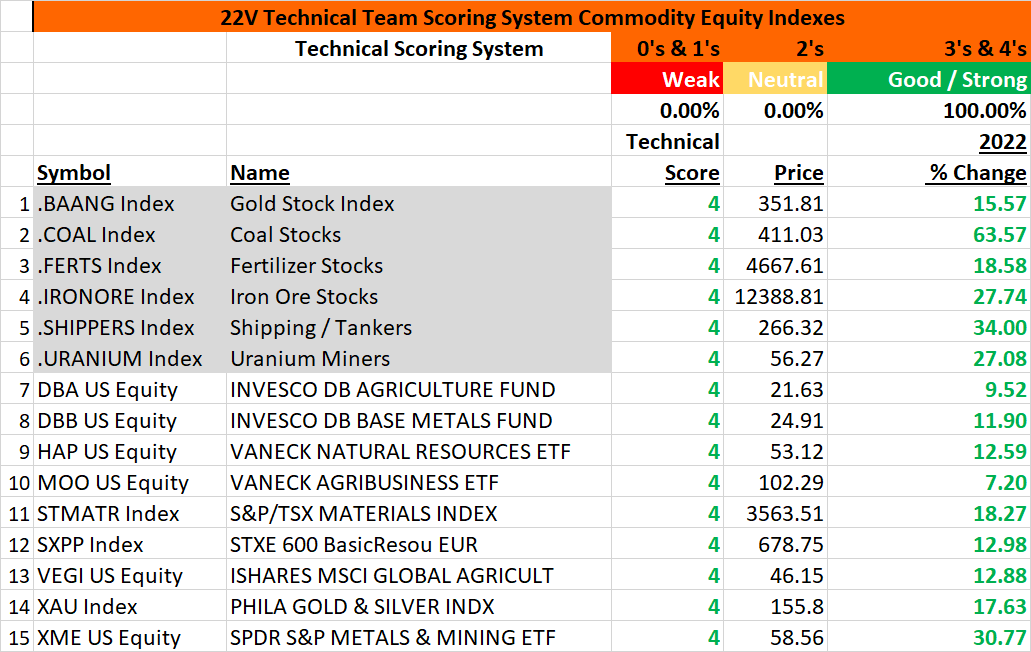
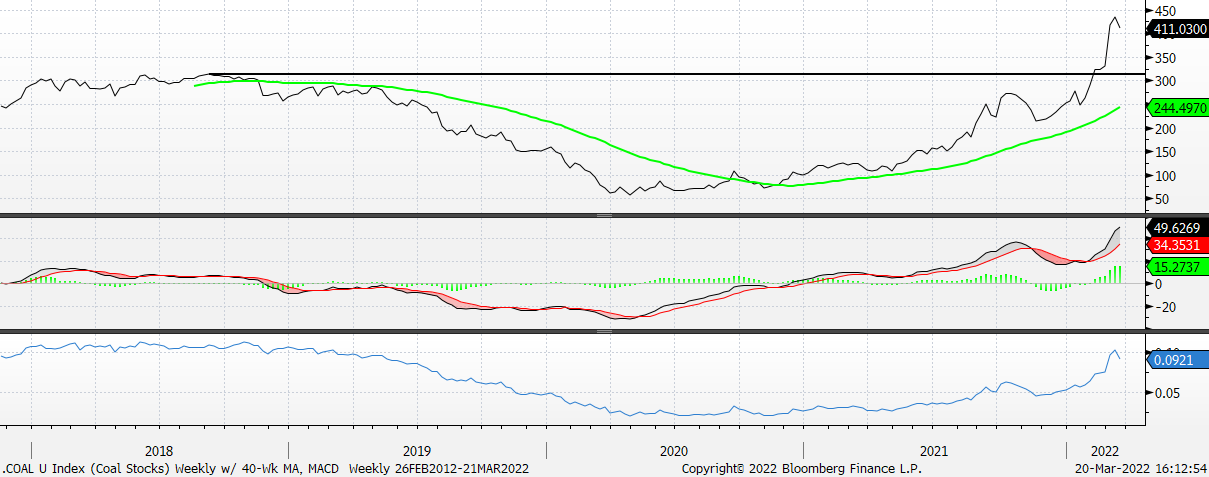
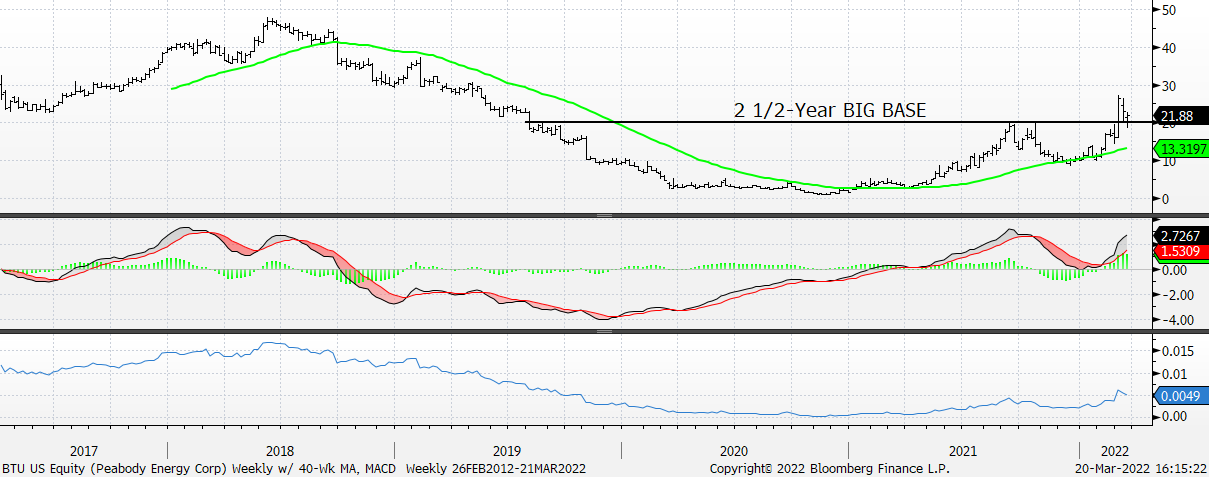
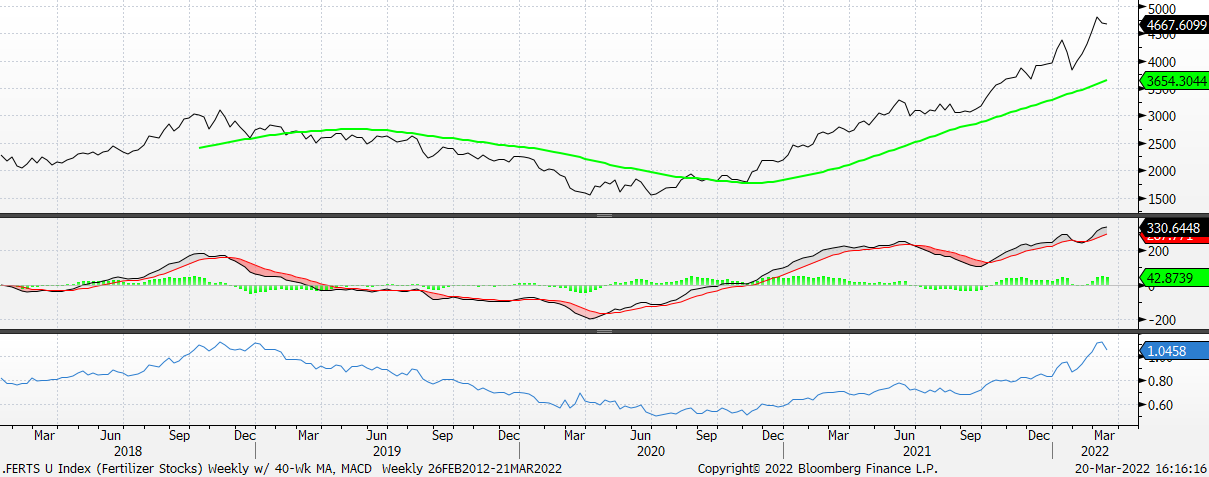
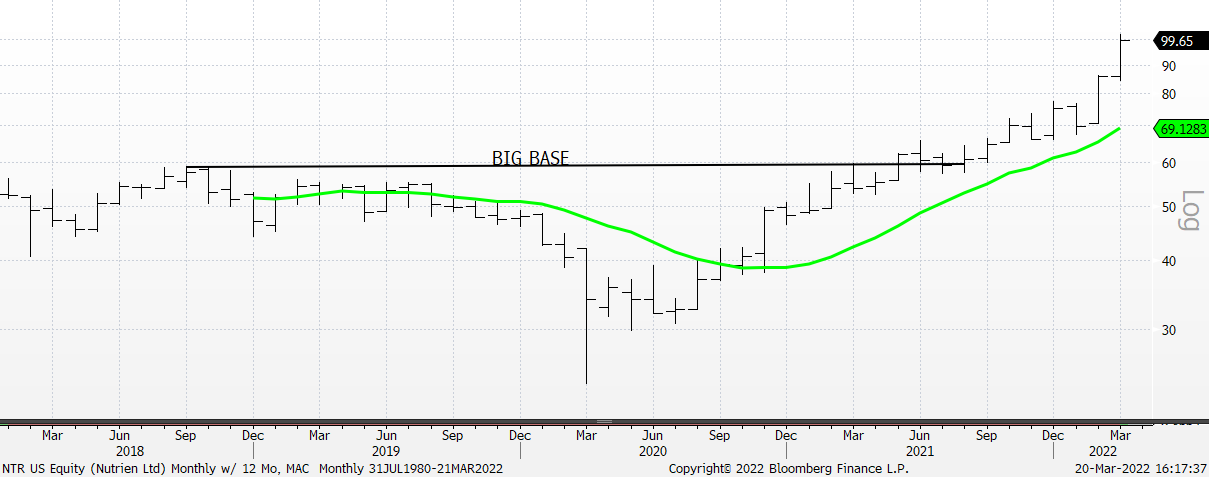
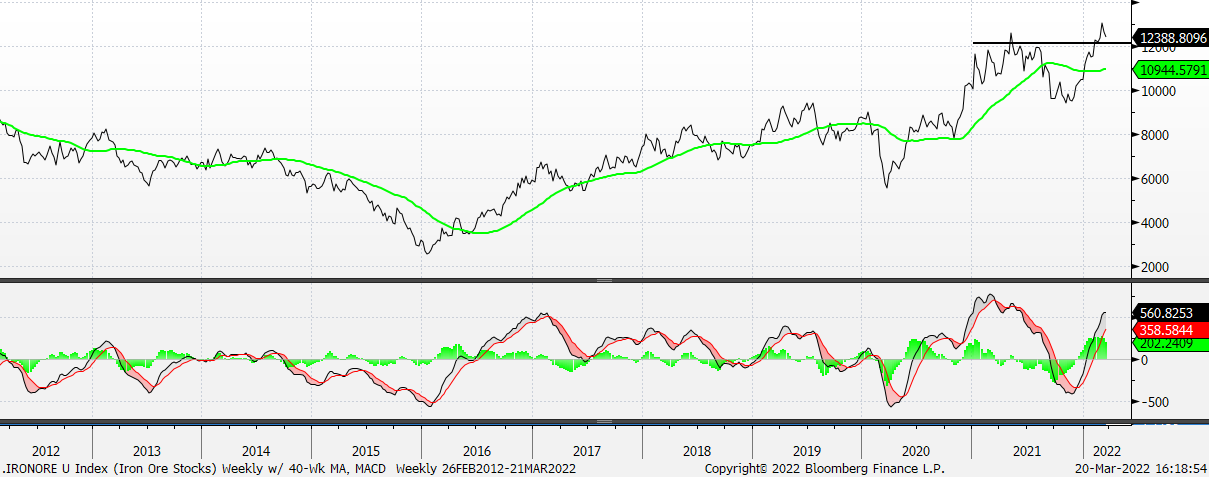
Our focus on the long side is with the following indexes. The first six are our own versions. And, just as an aside, the stocks in our Iron Ore Index have yields of 5.8%, 11.8%, 4.1%, 10.3%, and 3.8%
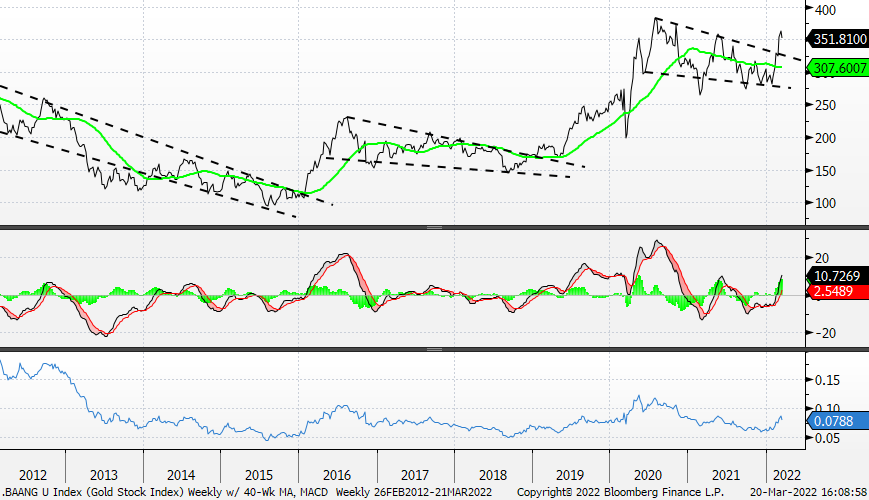
BAANG – Gold Stock Index – Weekly w/ 40-Wk MA, MACD and Rel to S&P
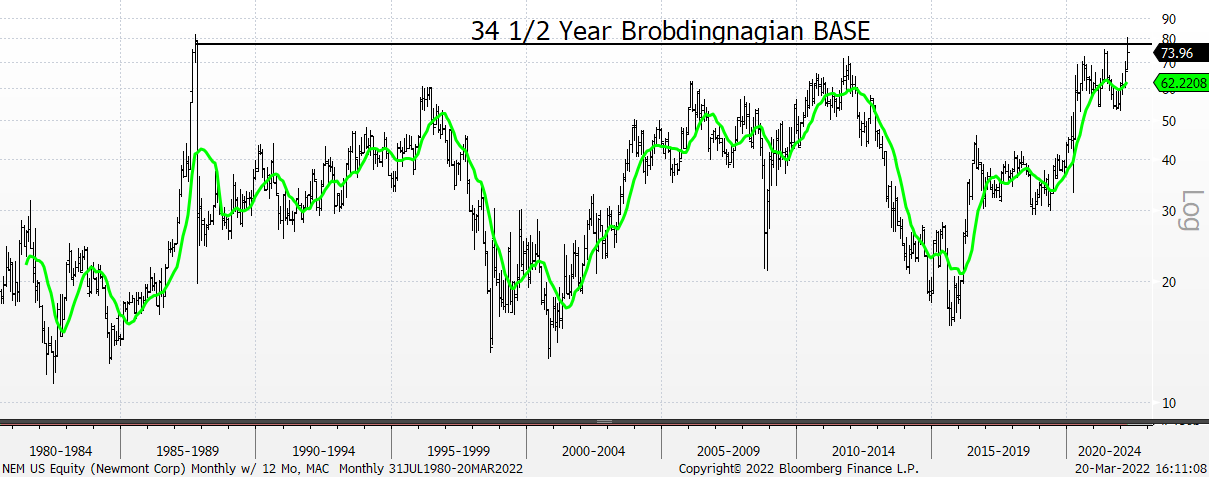
Newmont Mining – Monthly w/ 12-Month MA: 34 ½ Year Brobdingnagian BASE
Coal Stock Index – Weekly w/ 40-Wk MA, MACD and Rel to S&P
Peabody Energy – Weekly w/ 40-Wk MA, MACD and Rel to S&P
Fertilizer Stock Index – Weekly w/ 40-Wk MA, MACD and Rel to S&P
Nutrien – Monthly w/ 12-Month MA
Iron Ore Index – Weekly w/ 40-Wk MA and MACD
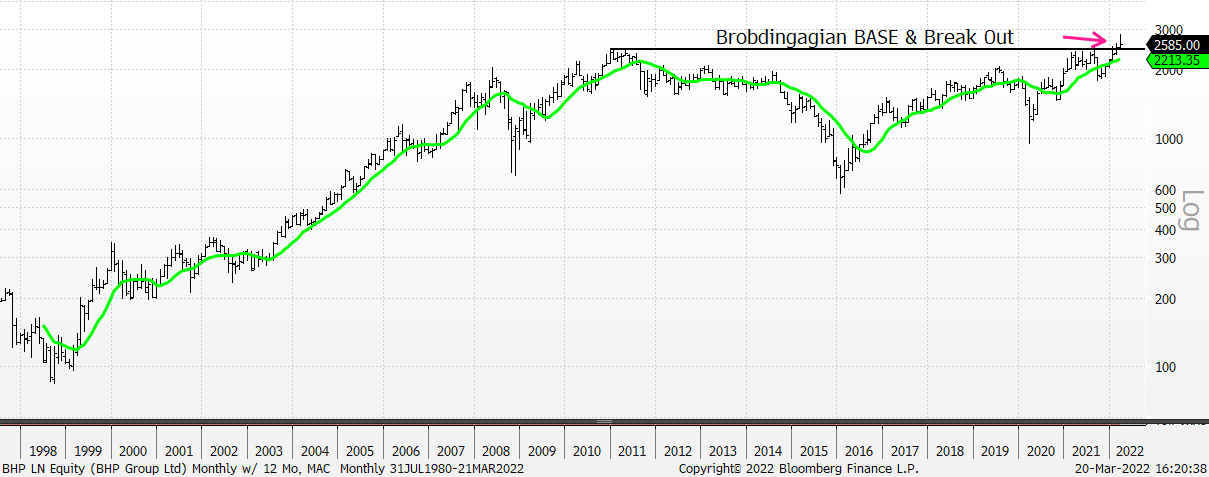
BHP Group – Monthly w/ 12-Month MA
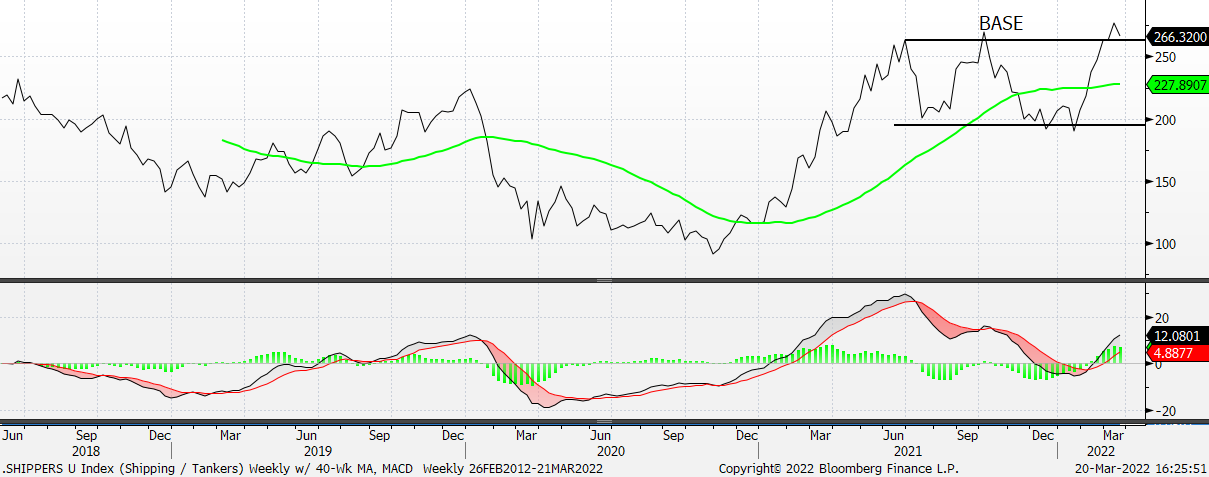
Shipping / Tankers Index – Weekly w/ 40-Wk MA and MACD
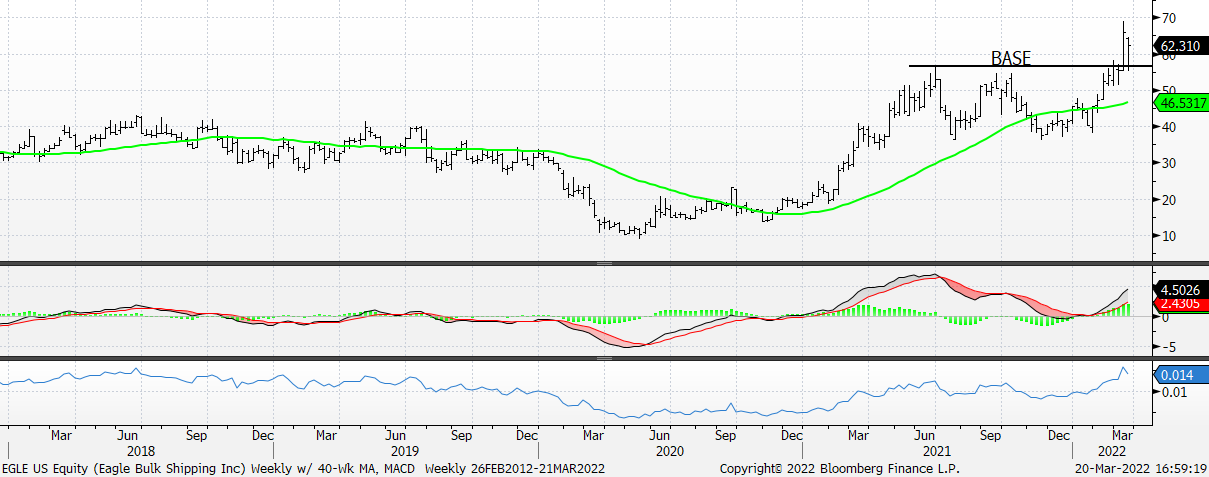
Eagle Bulk Shipping – Weekly w/ 40-Wk MA and MACD
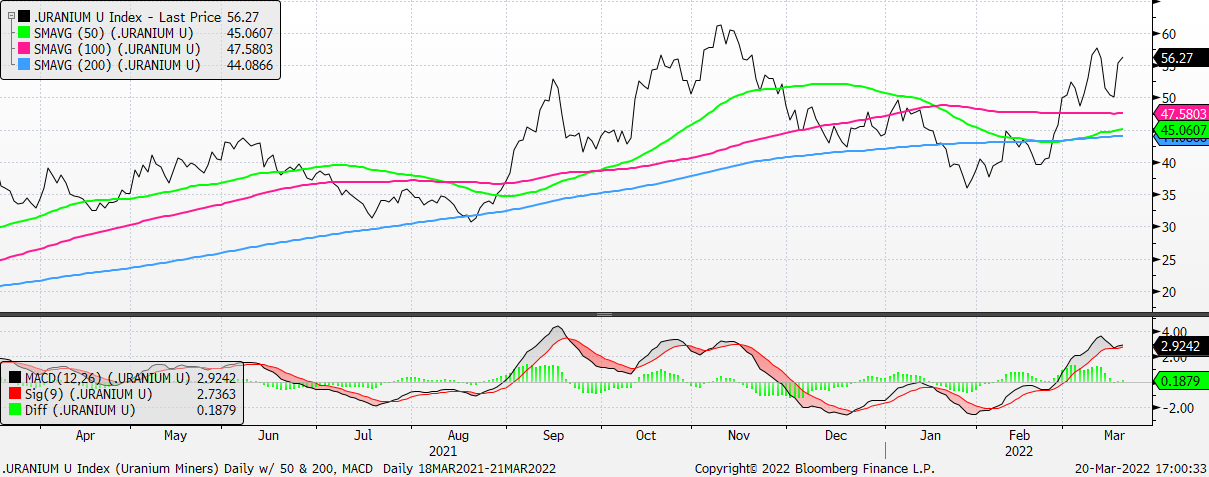
Uranium Index – Daily w/ 50-, 100, and 200-Day MAs and MACD
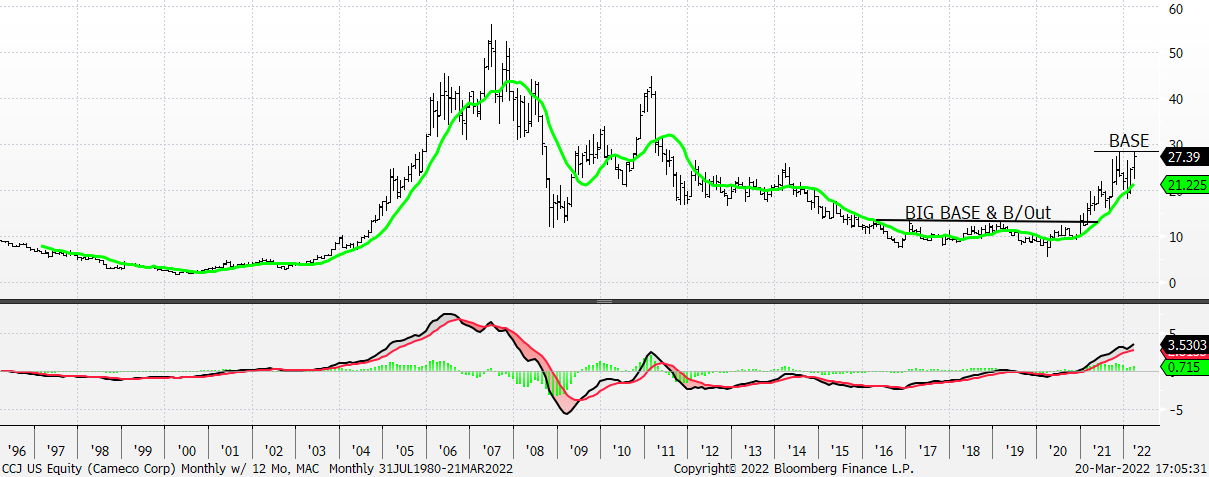
Cameco – Monthly w/ 12-Month MA and MACD
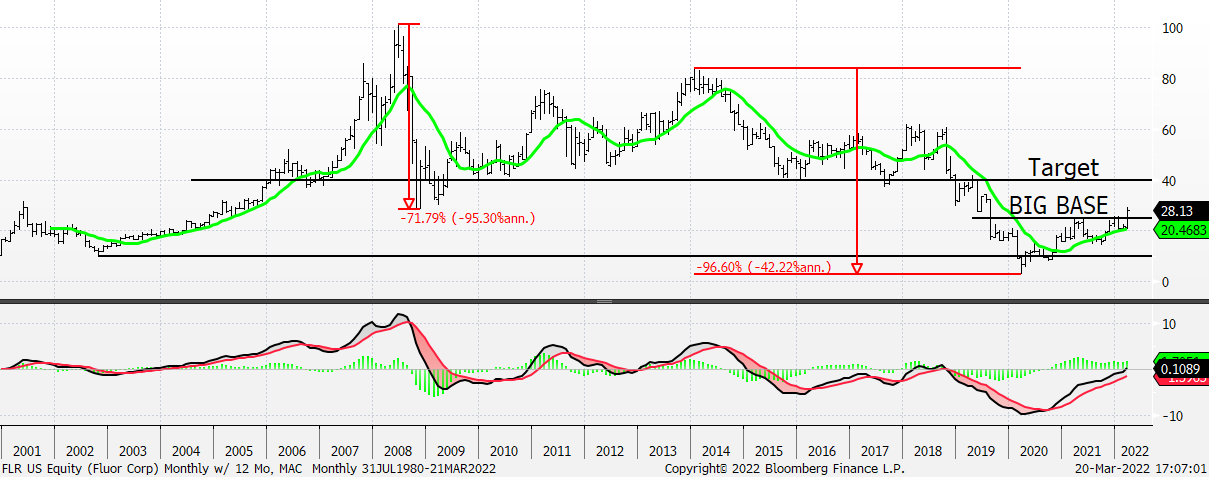
Fluor (FLR) is related to the Uranium theme – Monthly w/ 12-Month MA and MACD
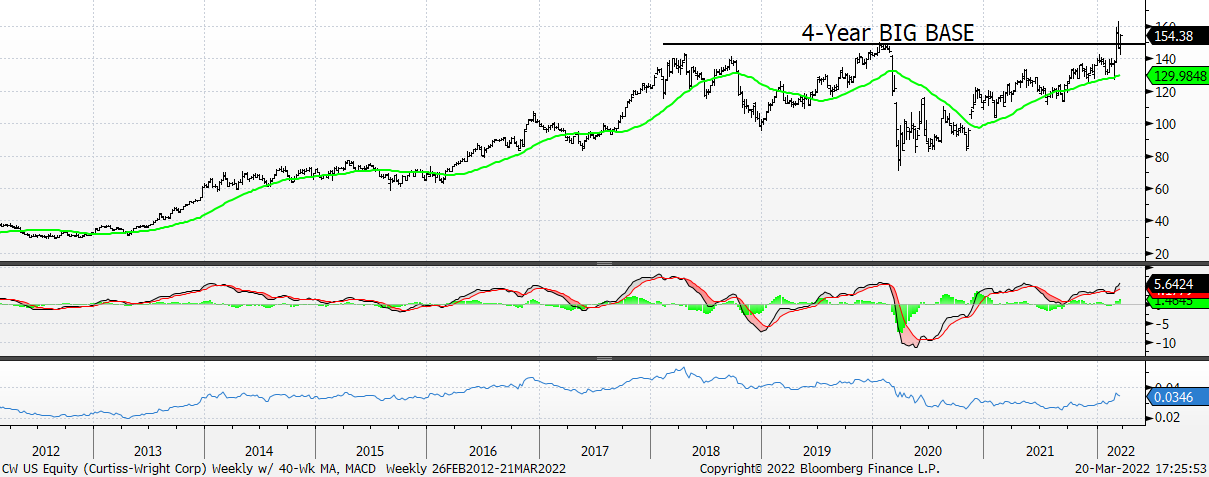
And so is Curtiss-Wright – Weekly w/ 40-Wk MA, MACD and Rel to S&P
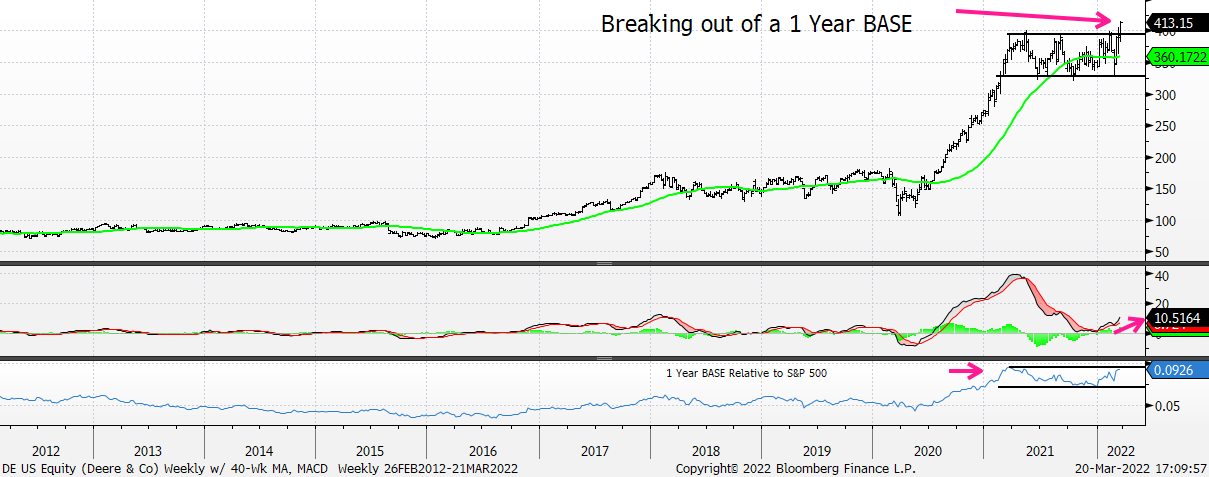
And we highlighted Deere in 22V’s Friday Webinar and Friday afternoon, too. Here it is again.