
Strategy Webinar: The Strategy Team will be hosting a webinar tomorrow, March 21st, at 1:00 PM ET. Searching for S&P fair value and market internals in an economy that will slow over the next 6-9 months. Register here for the Webinar.
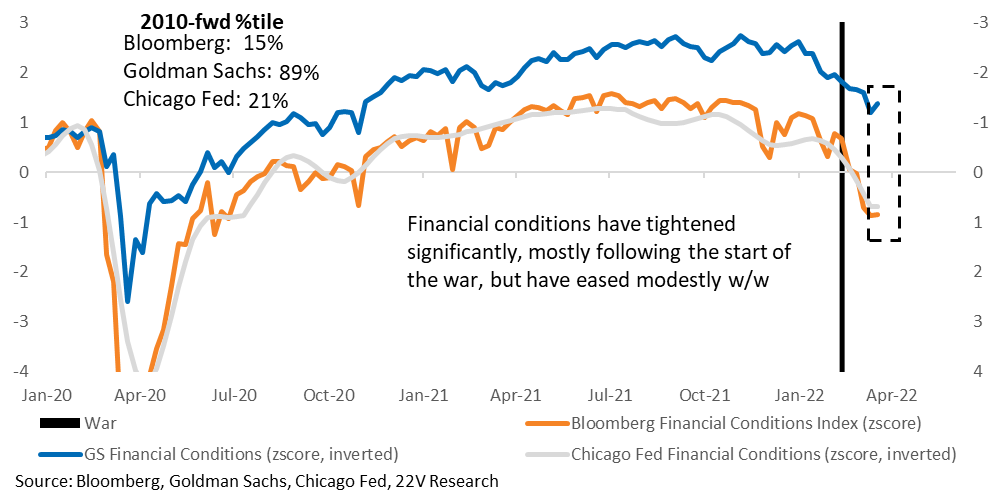
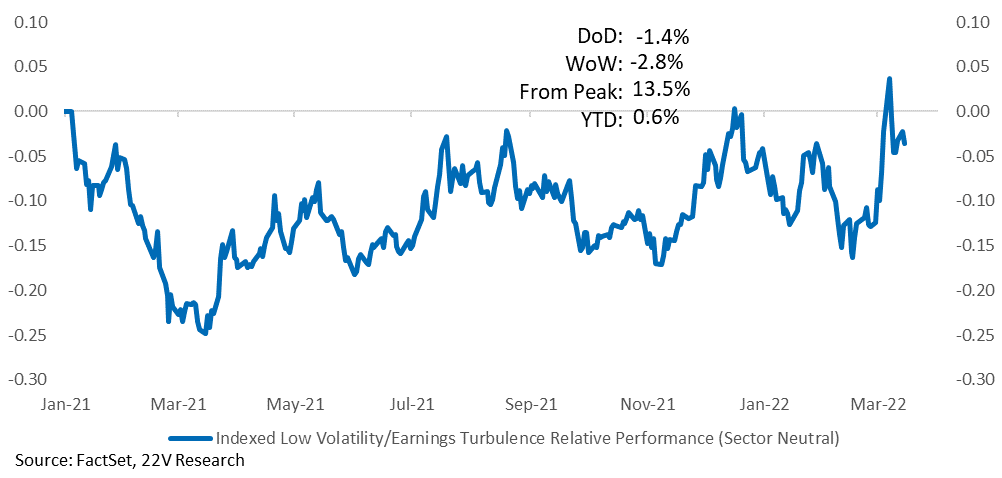
Summary: Financial conditions eased last week as the FOMC did nothing to meaningfully impact the expected funds rate path and oil prices declined. Lower oil is related to the assumptions the war will be contained to Ukraine, Russia’s comprised economic situation is unsustainable, and oil/gas will continue to flow. The S&P rallied 6.2% this week, its best 5-day gain since late-2020. War uncertainty and the Fed hoping for a supply side bail out on inflation (more on this below) have created a window where financial conditions can ease, or not tighten further, for a period of time. That is why earnings turbulence and high volatility stocks significantly outperformed and UST yields declined following the FOMC (real yields moved lower).
The above being said, the Goldman Sachs financial conditions index reversed in just a single week over 40% of the tightening achieved this year. Just last week we were talking about the Fed potentially being more patient in waiting to see the economic impact of tightener financial conditions and the war. Fast forward to today, financial conditions eased and the economic data last week was firm. At the beginning of the week China was shutting down. By the end of the week more stimulus and market support from China is assumed. If the payroll report is in line with consensus in a few weeks and CPI points to sustained above trend core PCE, expect odds of 50bp hikes in consecutive meetings to be increasingly priced in. As 22V Economist, Gerard Macdonell, has harped on, odds are low the Fed can get inflation to slow to trend WITHOUT increasing the unemployment rate. Once it becomes obvious upside risk to the employment rate exists, recession risk will increase.
February retail sales were strong enough to suggest quarterly real PCE growth will run at about 3% or slightly higher during the first quarter. Gerard highlights that “nominal PCE growth is extremely strong, with the trend there being close to 10% (ar). This is relevant because the Fed is concerned about inflation and because the same forces that may allow goods sector price inflation to come off the boil are likely to release pent-up demand for goods, such as in autos.”
All the above biases financial conditions tighter and growth slower in the future (beyond 6-9 months). Markets are likely to start discounting the slowdown, which is why we favor Quality Growth and Momentum longer term. Financial conditions re-tightening will eventually be a problem for the earnings turbulence names that rallied this week. Banks, Energy, Telecom, Auto and Consumer Services are still the most macro sensitive industry groups, so expect 1) volatility in the those groups to be high and 2) stick picking opportunities limited.
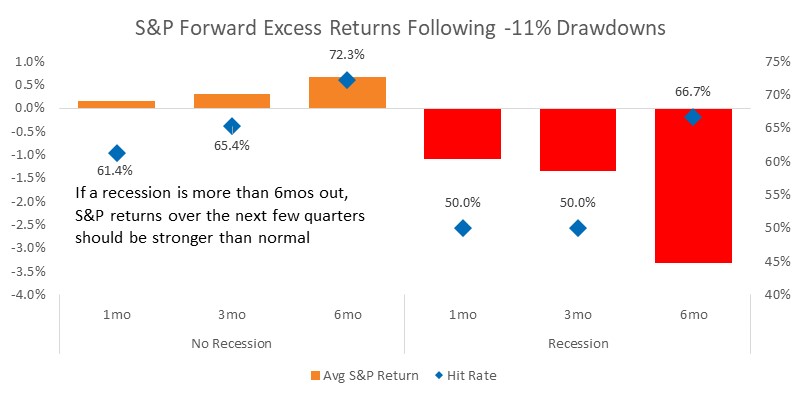
On the overall market, we continue to believe it is a tough short. Upside is limited while financial conditions need to tighten, and themes and factor rotations are a more important focus. Assuming oil prices don’t go above $150 quickly, near-term recession risk remains low (1yr out), which likely means an equity recovery before a recession. The market has already suffered the -11% drawdown typical ahead of recessions. Assuming a recession does not start in the next two quarters, given the selloff, market returns should be strong then normal. Which is the case historically. Also, analyst waiting for significant cuts to EPS estimates for companies might be disappointed. Numbers are coming down for sure, just not as quickly as many thought.
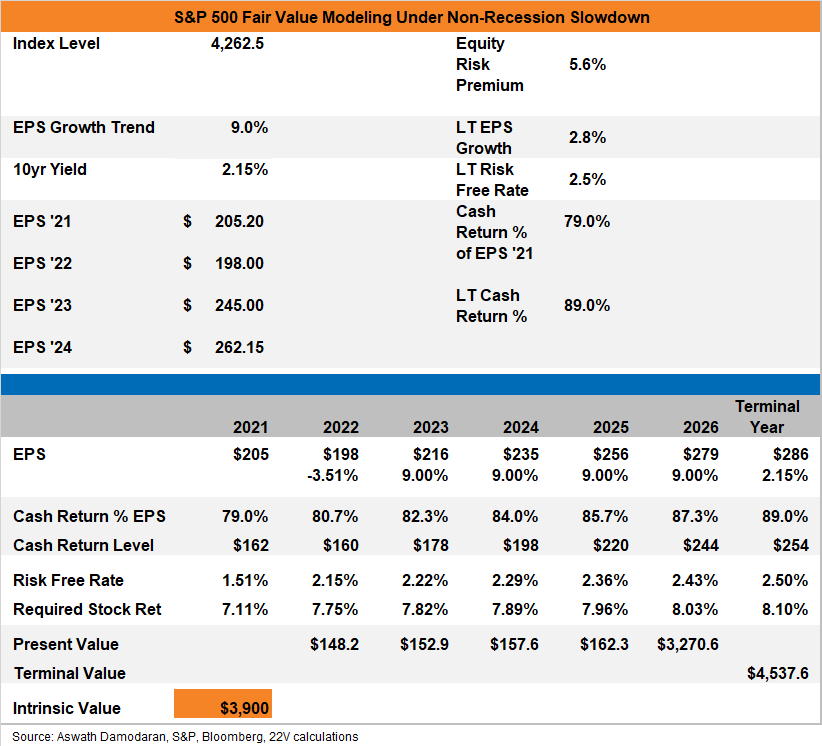
Downside Protection: Applying the current Implied ERP, which is unusually high historically, to a backdrop of 1) a 50% slowdown in revenue growth and 2) a 1pp decline in earnings margins, S&P fair value would fall to ~3,900. The above number needs some context though. At the start of 2022, the implied ERP was ~4.8%. Even under the sharp slowdown scenario (50% of expected revenue growth, a 1pp decline in margins), an ERP of 4.8% would put S&P fair value at 4570, or +2.4%% from yesterday’s close. At any ERP less than 5% (current is close to 5.5%) would leave S&P fair value higher. If the economy slows WITHOUT a recession and the Fed starts to back off, the ERP is highly likely to fall as the US economic moves further away from the zero lower bound constraint on policy. Investors need to internalize this point.
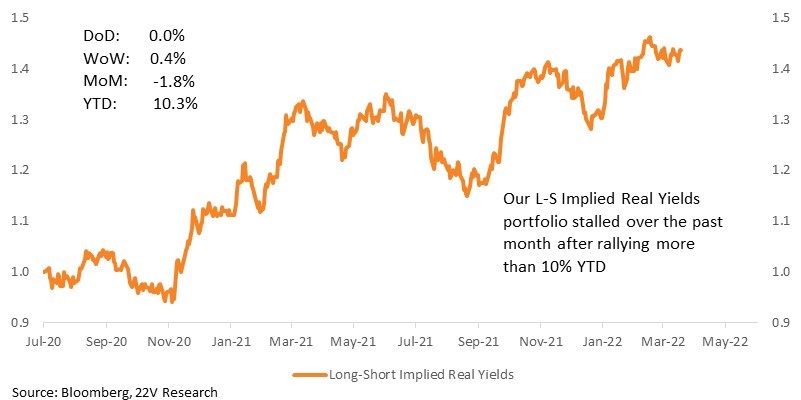
Themes Over Markets: The themes we remain most focused on today are stocks that benefit from improving supply chains (the basket has done well YTD) and stocks with pricing power. Over the past month, our Implied Real Yields L-S portfolio has stalled as financial condition tightening dominated market returns. This portfolio consists of stocks most highly correlated (positive/negative) to changes in implied real yields (10yr-5yr inflation swap). From the start of the year through the beginning of the war the Implied Real Yields portfolio gained just under 12%. Even after struggling the past month, it remains up more than 10% YTD. It should perform much better if more rate hikes are priced in (let us know if you would like the full constituents list).
Full Weekly Report Below…
Macro Backdrop: The lack of shocks from the FOMC this week, combined with difficult to quantify growth headwinds from the war, oil/commodity spike, have created a window where financial conditions can ease. If the payroll report is in line with consensus in a few weeks and CPI points to sustained above trend core-PCE, expect 50bp in consecutive meetings to be increasingly priced in.
Near-term, recession risk remains low, suggesting an equity recovery before a recession. The market has already suffered the -11% drawdown typical ahead of recessions. Assuming a recession does not start in the next two quarters, given the selloff, market returns should be strong then normal.
Tail risk lower = Low volatility giving back some of the gains. That can last for a bit, but the window of easier financial conditions is likely to be short lived. Payroll report will be important.
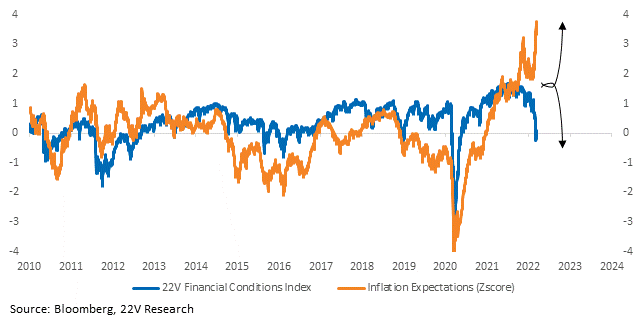
Bottom line, financial conditions will remain tight in an effort to slow inflation. The gap between inflation expectations and financial conditions will likely close (good for Growth stocks as that happens…FYI).
Markets have largely discounted the weaker economic growth backdrop. It’s really a question of the Fed or some other factor causing a recession or not
Searching For Fair Value: At the current ERP to a backdrop of 1) a 50% slowdown in revenue growth and 2) a 1pp decline in earnings margins, S&P fair value would fall to ~3,900.
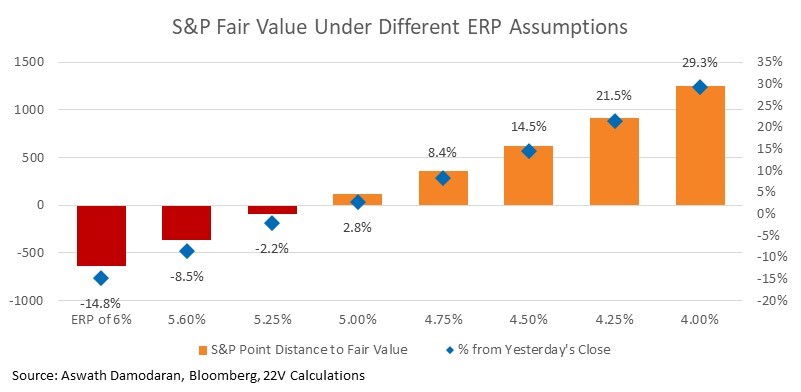
The above number needs some context though. At the start of 2022, the implied ERP was ~4.8%. Even under the sharp slowdown scenario (50% of expected revenue growth, a 1pp decline in margins), an ERP of 4.8% would put S&P fair value at 4570, or +2.4% from yesterday’s close. At any ERP less than 5%,S&P fair value is higher. If the economy slows WITHOUT a recession and the Fed starts to back off, the ERP is highly likely to fall as the US economic moves further away from the zero lower bound constraint on policy.
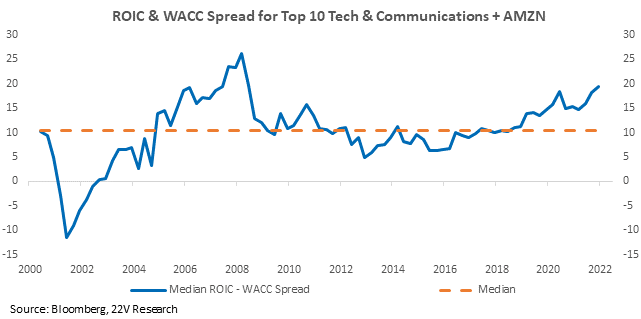
Increasing returns to capital have pushed median ROIC of mega cap Tech near 30% while the cost of capital has remained steady. Profit margins for Tech in general and mega caps in particular are high relative to most other groups. High profitability will become an increasingly important differentiator for stocks as inflation comes down, and that favors Tech/mega caps.
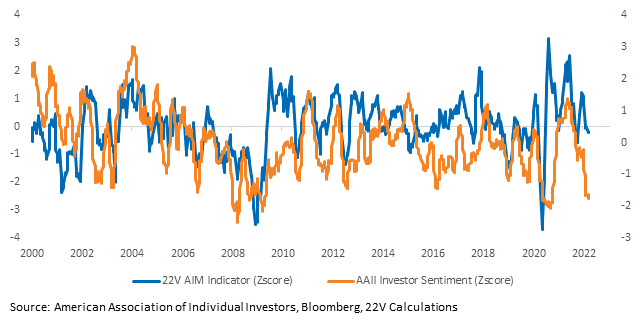
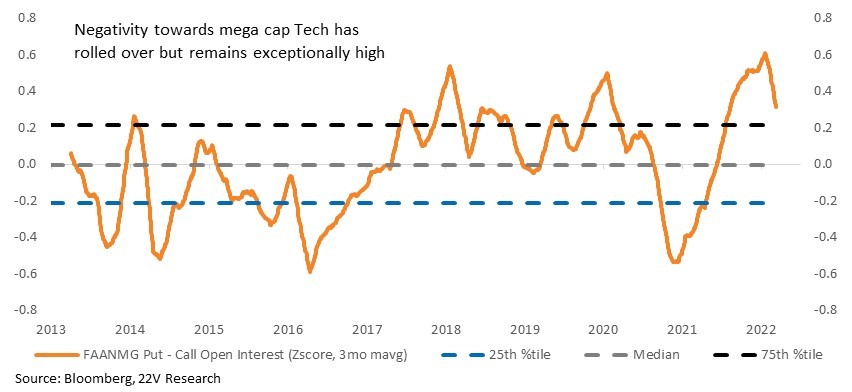
Negativity toward the mega caps peaked in early 2022 but remains extremely high based on the put/call ratio. A positive catalyst for the sector could help unwind that negative positioning and push the stocks higher, but there are no clear ones on the horizon.
Themes Over Markets: Over the past month, our Implied Real Yields L-S portfolio has stalled as financial condition tightening dominated market returns. This portfolio consists of stocks most highly correlated (positive/negative) to changes in implied real yields (10yr-5yr inflation swap). From the start of the year through the beginning of the war the Implied Real Yields portfolio gained just under 12%. Even after struggling the past month, it remains up more than 10% YTD (let us know if you would like the full constituents list).
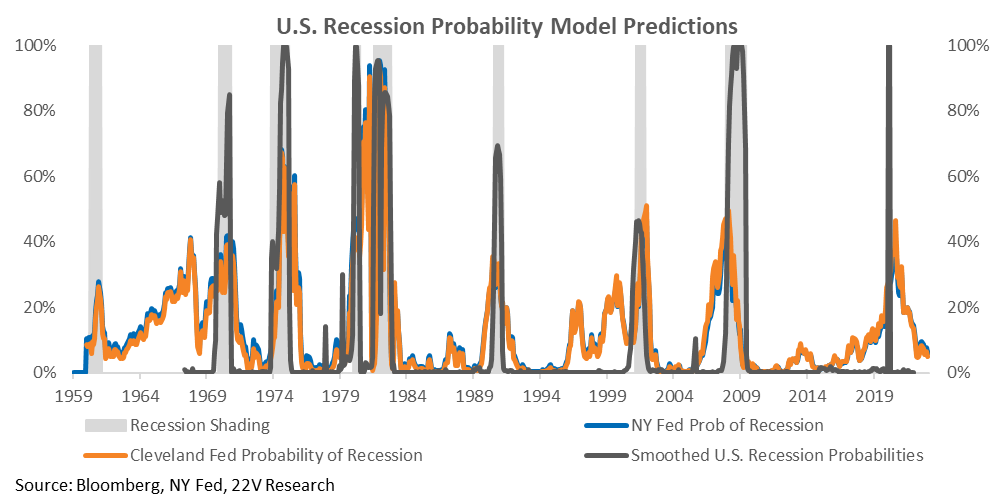
Recession predictions over a year out have a terrible track record, but short-term (several quarters) forecasts have fared better. Today, recession probability based on several Fed models show little risk a recession is coming. If a recession is more than 1 quarter away, market returns are likely to be positive through 1H22.
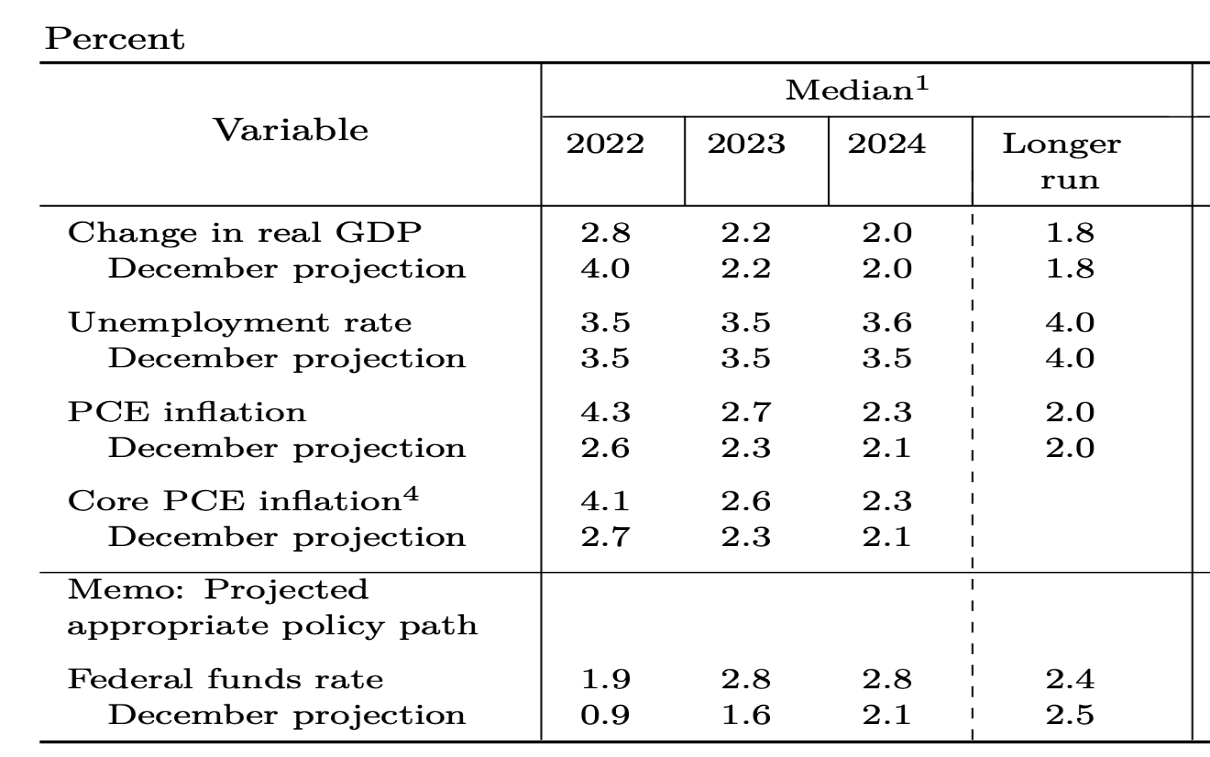
Economic Stuff From Gerard: The most striking aspect of the Fed event on Wednesday was the tension between the benign and somewhat magical forecasts presented in the Summary of Economic Projections (SEP) and Powell’s very hawkish tone in the Press Conference. And it is the hawkish tone that goes to the Fed’s objectives, which will have a longer shelf life than their certain-to-be-wrong forecasts. I was not the only analyst to wonder how they could project the core PCE inflation rate returning almost all the way to target, with the unemployment rate dropping below the natural rate and staying there. The simplest explanation is that the forecasts represent more a hope than an expectation. It would be odd for the Fed to forecast that they need to force growth below trend and the unemployment rate higher in order to reverse the inflation overshoot. And yet, that is the most obvious central case at this point.
Powell repeated described the labor market as extremely tight, even at today’s rate of unemployment, from which the labor market is projected to tighten further. When asked – a couple times – how they might expect inflation to fall in such an environment, Powell made a comment that gives away that the forecast framework is largely just pretend. He said that the ratio of vacancies to unemployed (v/u) is 1.7, which I depict in the left panel of the chart below as the log ratio of unemployed to vacancies (u/v) being just under -0.5%. But if the v/u ratio were to fall to 1, or my metric to rise to 0, then the inflation pressures in the labor market would dissipate, clearing the way for underlying inflation to fall. The problem with this is that there is no reason – or at least no compelling reason – to believe that vacancies would fall, indeed disproportionately with the declining unemployment rate, when the unemployment rate is indeed declining. As the right panel of the chart below shows, unsurprisingly, the vacancy rate tends to rise when the unemployment rate falls.
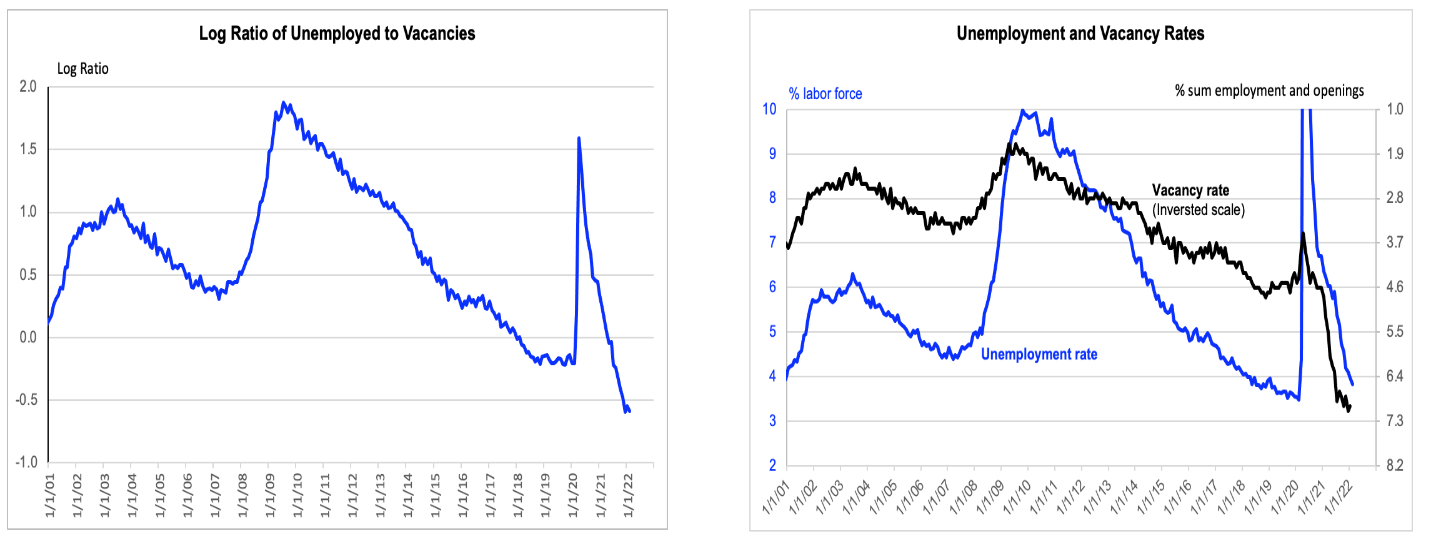
Source: Federal Reserve Bank of St. Louis FRED, Bloomberg, FH calculations
Unemployment rate is actual to February while the vacancy rate is actual to January. For the purpose of calculating the series in the left panel I assume that vacancies were unchanged in February.
Last week’s retail trade report for February was strong enough to suggest that quarterly real PCE growth will have run at about 3% or slightly higher during the first quarter. There is a slight launch effect in that figure, and it is probably fairer to say that the underlying trend recently is closer to 2%, reflecting the Omicron soft spot and lingering supply chain issues in the goods sector. However, nominal PCE growth is extremely strong, with the trend there being close to 10% (ar). This is relevant because the Fed is concerned about inflation and because the same forces that may allows goods sector price inflation to come off the boil are likely to release pent-up demand for goods, such as in autos. It may seem odd to refer to pent-up demand, given the boom on the goods side recently. But some forms of goods consumption have been held back by supply, quite obviously.
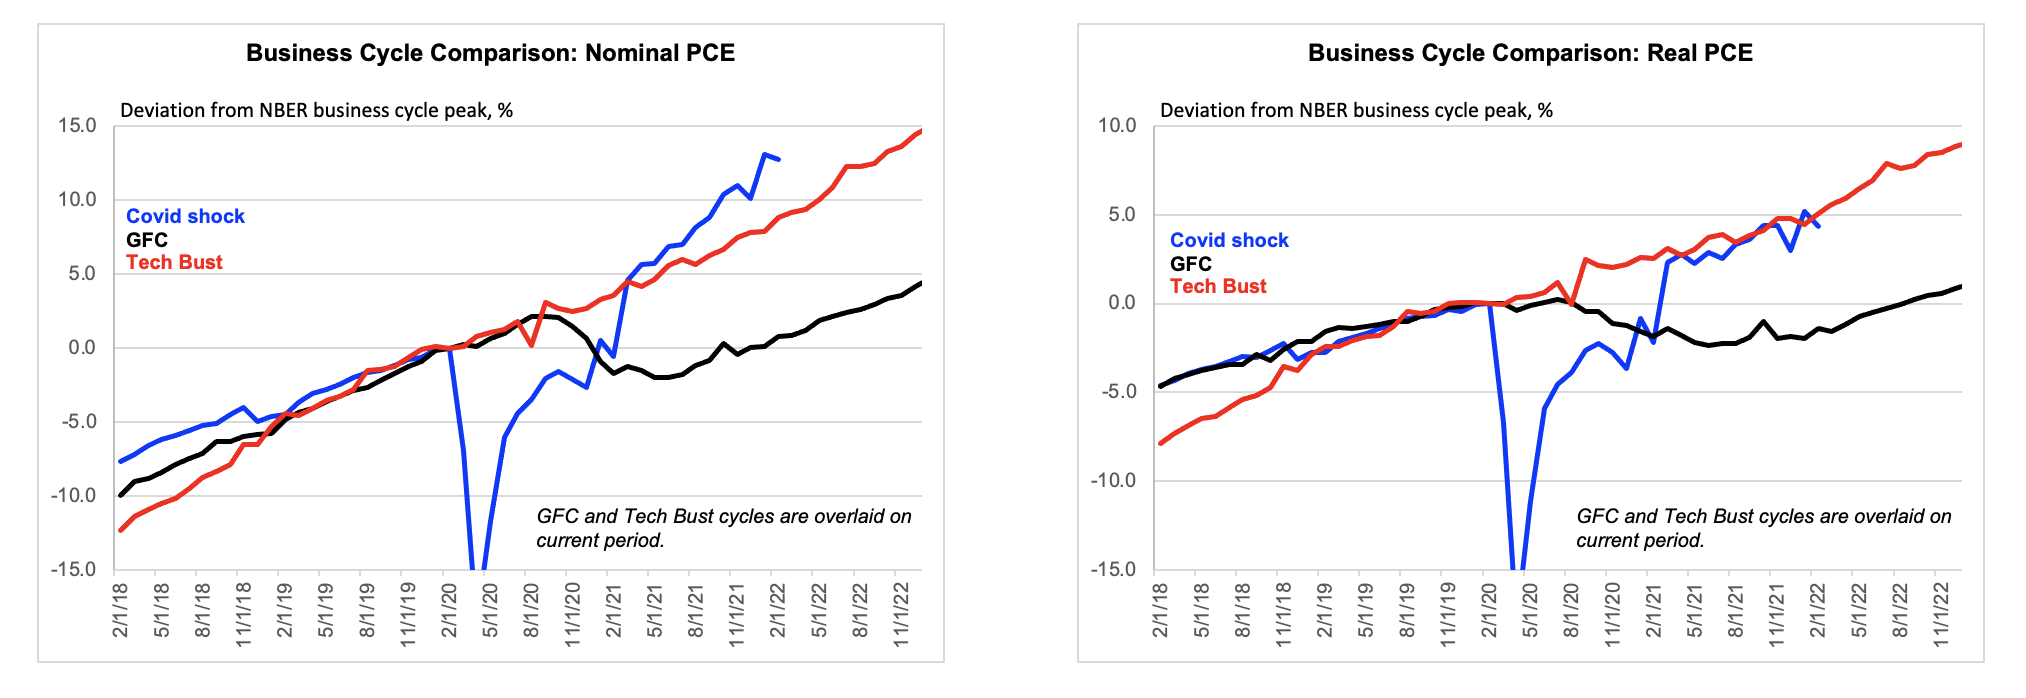
Source: BEA, Federal Reserve Bank of St. Louis FRED, FH estimates
Data are actual to January and estimated to February.

