
Our entire repository of COVID charts is HERE.
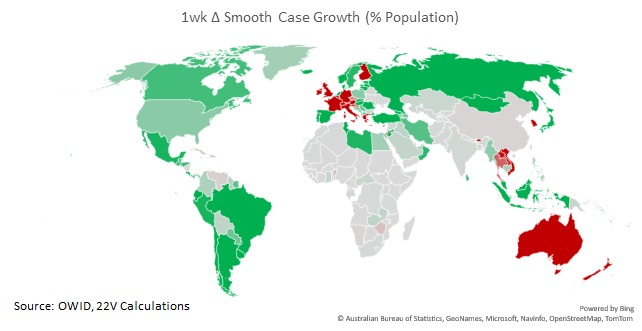
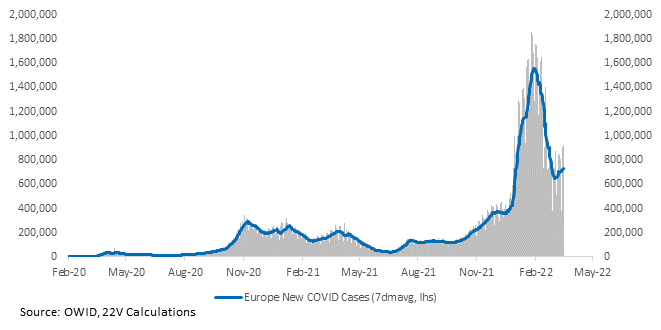
Once again, case growth is increasing across Europe. It’s unclear whether the increase is a product of more activity and larger groups, immunity waning, or the BA.2 Omicron subvariant (more contagious than the original Omicron, but no more severe). Given there is no sign of a new variant (different from subvariant), we don’t expect a potential wave to differ from the low severity experienced in the first Omicron wave.
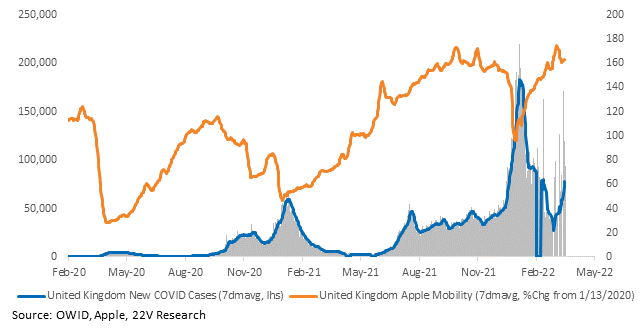
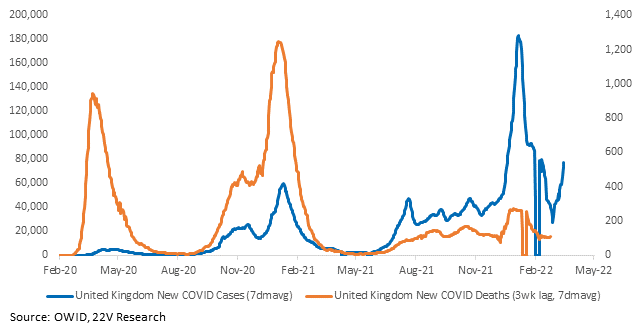
Mobility in the UK is resilient despite accelerating case growth. Rates are increasing across all demographics. Nationwide hospitalization data has only been updated through March 6, before cases started increasing in earnest. Scotland has more timely data, and it’s data is consistent with how the first Omicron wave played out. Again, there is no reason to suspect a potential wave will be different from the mild severity in the first Omicron wave.

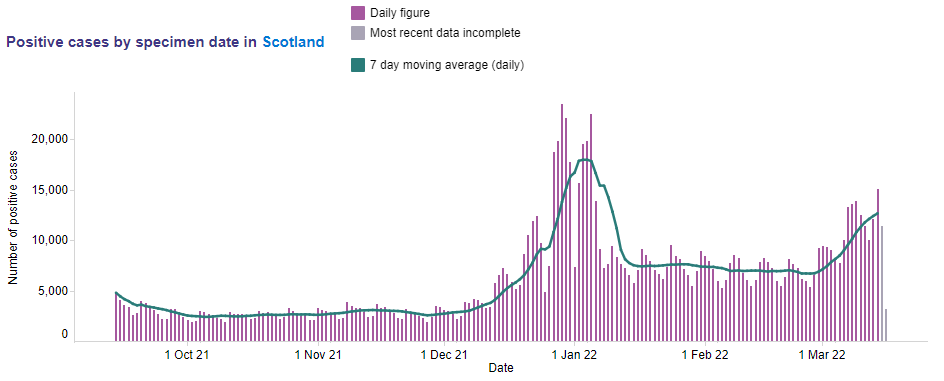
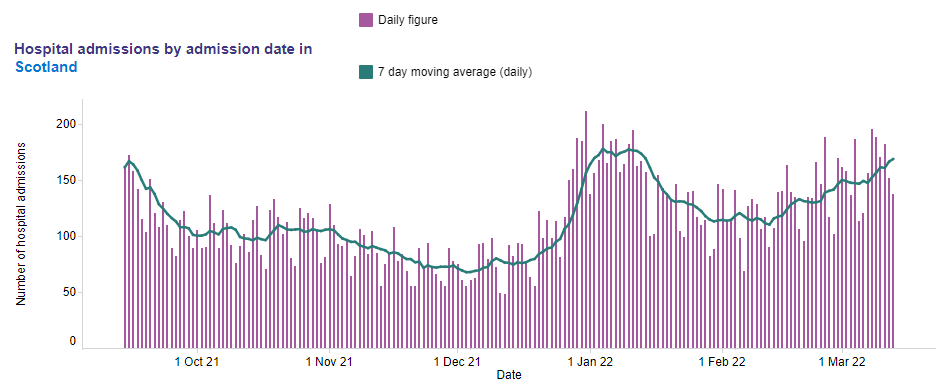
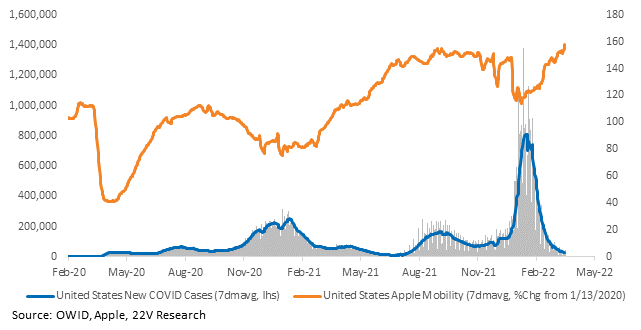
Europe has led the U.S. in every wave. And BA.2 has been found in the States. The Omicron was not as disruptive as was feared. We see no reason to sound the alarm.
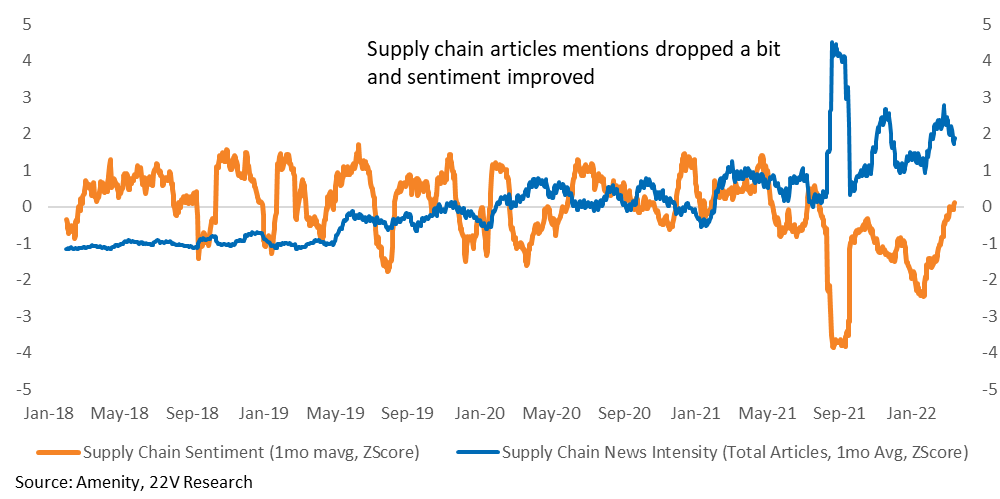
Overnight, Xi Jinping addressed the Politburo, announcing China should stick to its COVID policies, but minimize the impact on the Chinese economy and people’s lives. This is a net positive sign for activity (and thus supply chains). Supply chain sentiment, measured using the Amenity natural language processor, actually improved this last week while intensity decreased, despite the lockdowns in China.
That’s partly because the COVID waves in other important supply chain countries are either improving or not having a large effect on activity. South Korea has the worst case growth rates, but is set to lift almost all social distancing requirements in the coming weeks. This wave lacks the compounding supply chain constraints that were so disruptive in 2021.
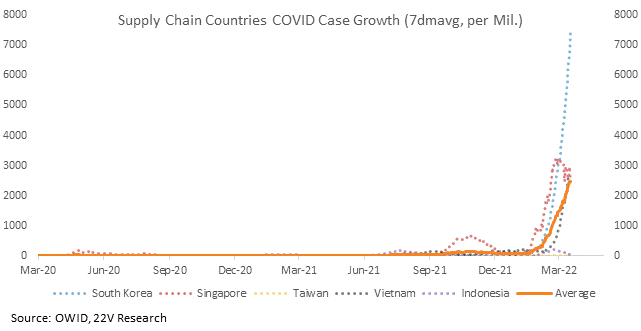
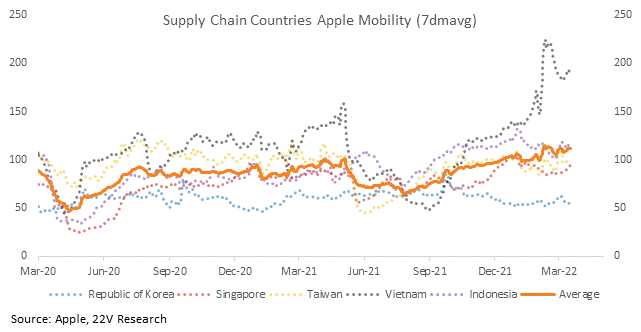
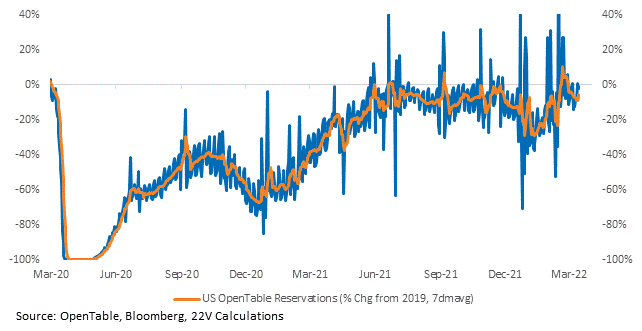
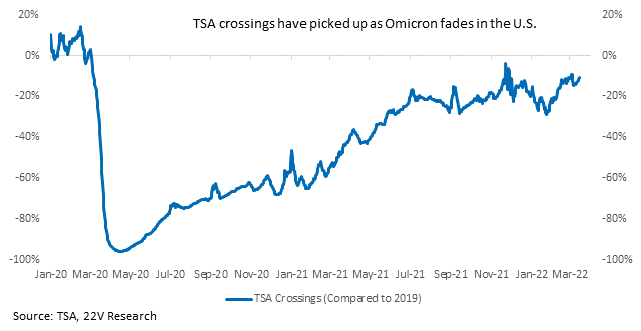
This bout of lockdowns is unlikely to generate as intense inflationary pressures as in 2021 given tighter financial conditions, lower real wages, and some normalization of consumer spending back into services. It’s also important to keep in mind Omicron is much less severe than prior strains, providing policy a potential out. Spending on goods vs services in the U.S. has been stickier than most anticipated but there is evidence of behavior slowly shifting; OpenTable data and TSA crossings are at or near post-pandemic highs. As long as the improvement in service trends continues, expect less supply chain pressure related to goods. Also, inventories are in a better place now than last fall.
Charts for every state and country we have data for are HERE.

