The S&P has fallen -11% from its all-time peak reached at the beginning of the year, implied volatility has moved to the high end of its COVID era range, commodity prices have moved sharply higher, and bond have sold off. With the Fed expected to start a long rate hiking cycle later today, and the war continuing in Eastern Europe, investors are concerned about a sharp slowdown in growth or possibly a recession over the next several quarters.
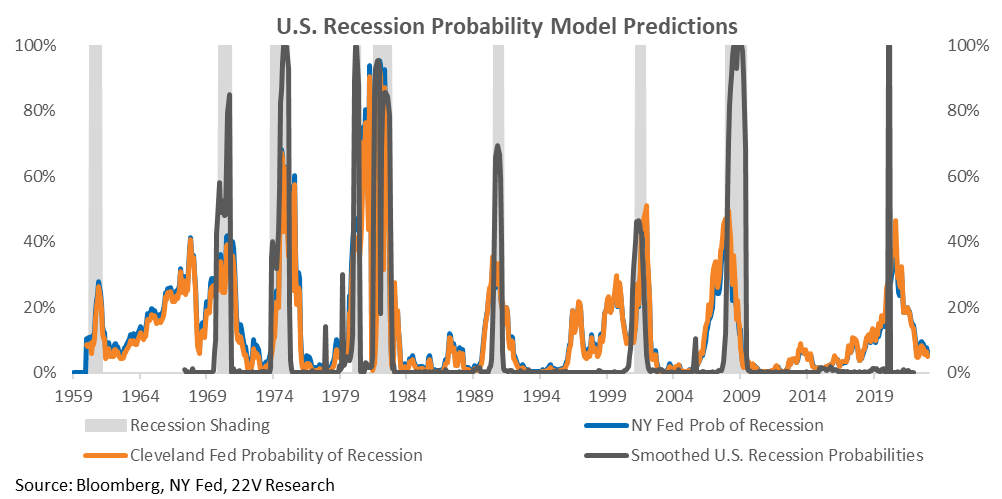
We looked at several recession prediction models and applied a machine learning classification model – Gaussian Mixture Model – to the current macro backdrop. Multiple prediction models from the Fed and our own machine learning classification indicate the risk of a recession remains low, and that the current backdrop is better classified as one of ongoing growth. Economic data is likely to weaken over the coming months, increasing recession probabilities, but there are no clear signs that a recession is either imminent or unusually likely.
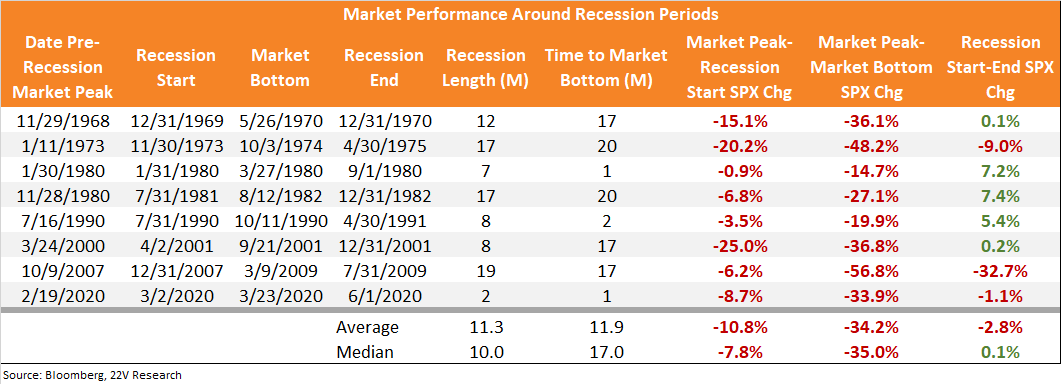
Historically the market peaked well ahead of recessions and bottomed well before the end of a recession. It is possible the market peak for this cycle has been put in, but recession odds remain low and non-recession market corrections (-10% drawdowns) are typically followed by positive returns over the next two quarters. Since 1968, the median drawdown around recessions has been -35%, but most of that decline comes AFTER the recession officially begins. Ahead of recessions, the S&P has fallen an average of -10.8%, suggesting that investors have already discounted a significant slowdown/pre-recession backdrop.

Market correlation tends to increase in the lead up to recessions, making stock picking more difficult. Today, the absolute level of correlations across the market and most industry groups remains low but is likely to trend higher until the outlook for medium term growth becomes clearer. As we have highlighted, thematic positioning has and should continue to do well while volatility and uncertainty remain elevated.
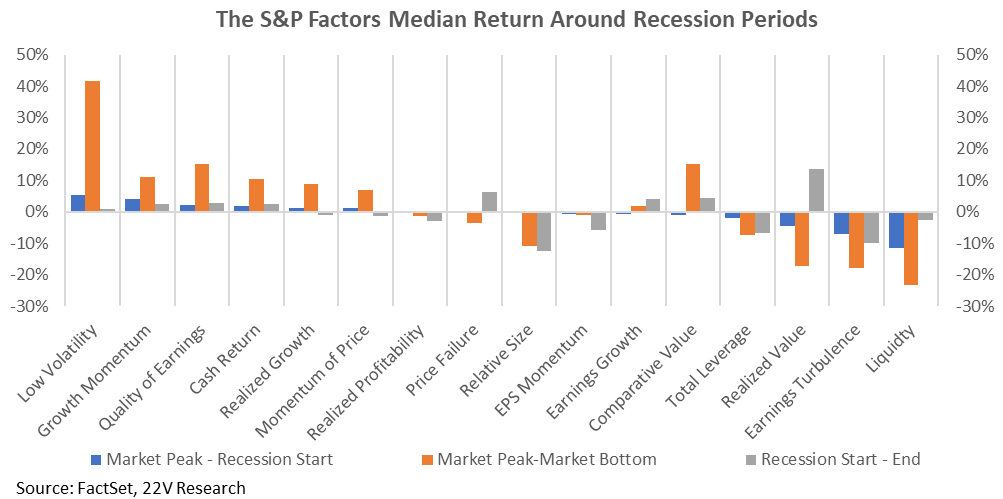
From a factor positioning standpoint, in pre-recession periods low vol, higher momentum stocks, along with quality and cash return, typically perform best. Returns to those factors are even stronger during recessions. In the near-term, regardless of the ultimate path of growth, aligning to factors that benefit from tightening financial conditions continues to make sense. If a recession does unfold, those factors should lead internals. A rotation into more risk-on factors (Value, EPS momentum, leverage, etc.) if it becomes clear a recession will be avoided.
What We Can Learn from Historical Recessions? As the S&P has dropped 11.1% from an all-time peak reached at the beginning of the year, implied volatility has moved to the high end of its COVID era range, commodity prices have moved sharply higher, and bond have sold off. Expectations the Fed will begin its first COVID-era rate hiking cycle later today has rattled investors as well. As the maxim goes, the Fed tightens until “something breaks”, leading to increased concerns of an imminent recession. Recession prediction beyond a few quarters has a terrible track, but short-term (couple of quarters) forecasts have fared better. Today, recession probability based on several Fed models show little risk a recession is coming. If a recession is more than 1 quarter away, market returns are likely to be positive through 1H22.
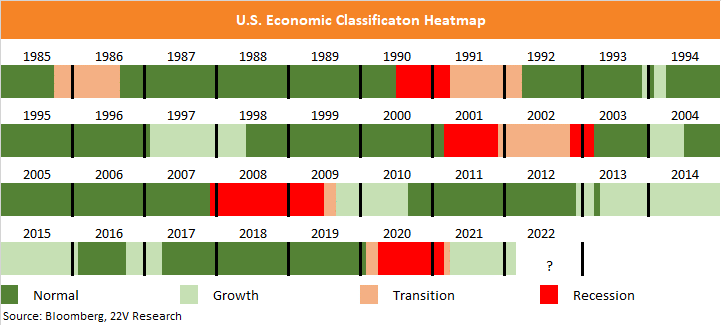
Applying a Gaussian Mixture Model (GMM) for economic cycle classification based on monthly YoY percent changes of 17 macro indicators such as the U.S. yield, inflation, and commodities prices, etc., we can place the current economic backdrop into four broad growth groupings – Normal, Growth, Transition, Recession. The model approach classifies the current macro backdrop as far from historical recession periods, and more similar to early-2010 and 2013-2015, Growth period. A transition from Growth directly to Recession is atypical.
Equity prices are anticipatory, and the market peaks typically occur well ahead of official recession starts. Market also bottom well ahead of the official end of recessions. We list the S&P performance around historical recession periods since 1968. The median drawdown around a recession is -35%, with the majority of the declined coming after the start of the recession. The pre-recession market drawdown is typically around -11%, like today. Importantly, there are far more market corrections than there are recessions. If a recession is more than 1 quarter away, -10% drawdowns are typically followed by positive returns over the next 6mos.
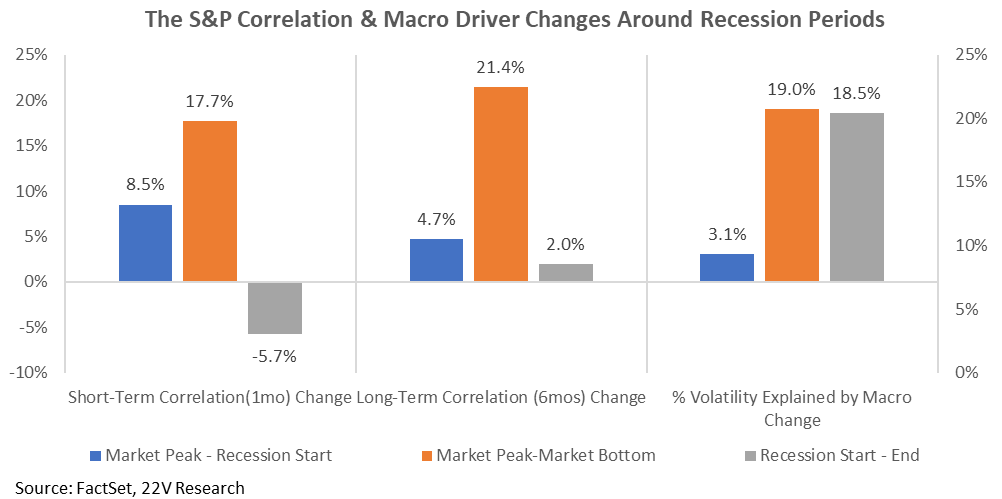
Pre-recession periods typically see a marked increase in correlations and macro influence over market volatility. Stocks tend to move more together as markets peaked and turn into recession. Higher correlations make outperformance through stock selection more difficult, and good hedges harder to find. Correlations tend to decline once a recession starts. In the near-term, as uncertainty about the growth outlook remains high, investors should expect increased correlations and higher macro variability. Both remain low today.
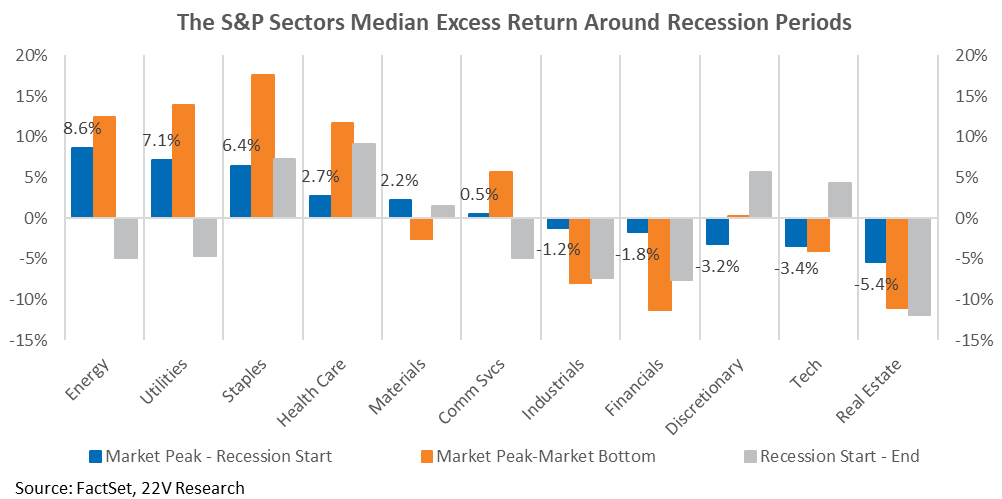
At the sector level, Energy and Defensive names usually outperform during pre-recession market downturns. Energy performed better at the beginning of a market declining while Defensives took leadership as a recession started. Interestingly, the sector performance YTD shares some similarity with the market performance after a market peak. Intra-recession performance of Cyclicals and Defensives is less consistent with, Staples, Heath Care, Discretionary and Tech all outperforming. This suggests Defensives will lead as long as recession uncertainty remains high.
At factor level, Low Volatility took the leadership flowing a market peak. Quality of Earnings, Comparative Value and Growth Momentum also outperformed before the market bottomed. Factors facing the most headwind were Liquidity, Earnings Turbulence and Realized Value. Today, with the Fed clearly signaling its desire to tighten financial conditions, factor positioning for a possible recession makes sense. While financial conditions tighten, low vol, higher quality names should outperform. If the Fed does break the economy, lov vol, quality names have significant upside. A persistent rotation into more risk-on factors will become more likely if it becomes clear growth will slow without triggering a recession.