It’s legend that, “Nero fiddled while Rome burned.” Repeat, it’s a legend. But the underlying meaning of the line is to do something irresponsible while a serious, and sometimes grave, situation unfolds.
How serious? Well, Italy’s year / year figure for its PPI was a whopping 42% for January 2022. That’s the 10th month in a row where the year / year results have been at least 8%, the 9th month in a row of double-digit year / year increases, and the fourth month in a row of results that were at least +25% year / year. Fiddling indeed. The month / month figure for January 2022 (vs. December 2022) was 12.4%. We don’t think Italian’s agita will be soothed by a Brioschi knowing that hyperinflation is defined as month / month increases of at least 50%.
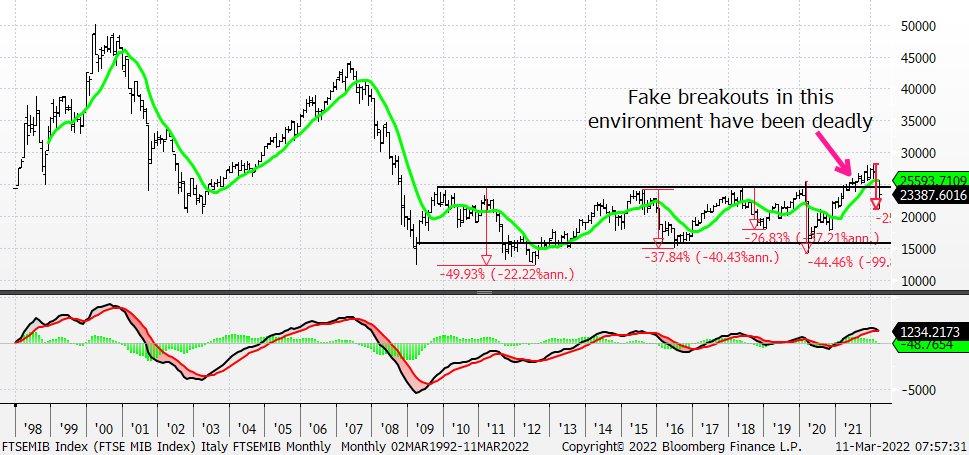
The FTSE MIB Index is up 2% today with similar action occurring across the breadth of Europe’s equity markets. But we continue to believe that Italy’s equity market is a sale, and we want to use today’s bounce to reduce longs and we’ll do the same thing on any bounce that takes the index to / near 25000. It’s 23348 as of this writing.
We believe the message offered by the FTSE MIB’s monthly chart below is clear – (A) the breakout above 25000 in Oct 2021 was fake and we know that fake breakouts in this environment have been deadly, (B) the index is now firmly back into its former range, (C) prior turn downs from the top of the former range nearly all resulted in trips to the bottom of the range, (D) the index is below its cresting 12-month moving average and (E) the monthly MACD is cresting from an overbought level. (A) – (E) tell us Italy’s equity market is a sale.