It occurred way back in September 2004 when the Boston Red Sox were making a furious charge at the Yankees’ American East lead. Pedro Martinez, into his eighth year of dominance (he was 134 – 45 for a Won-Loss % of 75% from 1997 – 2004), lost two consecutive starts to the Yanks and, befuddled at his inability to beat the Sox’ archenemy, said in a post-game press conference, “What can I say? Just tip my hat and call the Yankees my daddy.”
We thought about Pedro (his greatness cannot be overstated) and his quote last evening when thinking about how Freeport-McMoRan has outperformed The Last Emperor, Microsoft, and put Microsoft in Pedro’s shoes and altered the quote as follows, “What can I say? Just tip my hat and call Freeport-McMoRan my daddy.” Here’s what we mean:
YTD 2022: FCX is +16.4%, MSFT is -10.6%
Y/Y: FCX is +38% y/y, MSFT +28.5%
Over 2 Yrs: FCX is +362%, MSFT is +74%
Since COVID low: FCX is +677% (not a typo), MSFT is +122%
Over 3 Yrs: FCX is 279%, MSFT is +168%
This might be an example of “cherry picking,” but we’ve had plenty of conversations with institutional investors to believe that they have not yet embraced the commodity / commodity equity cycle.
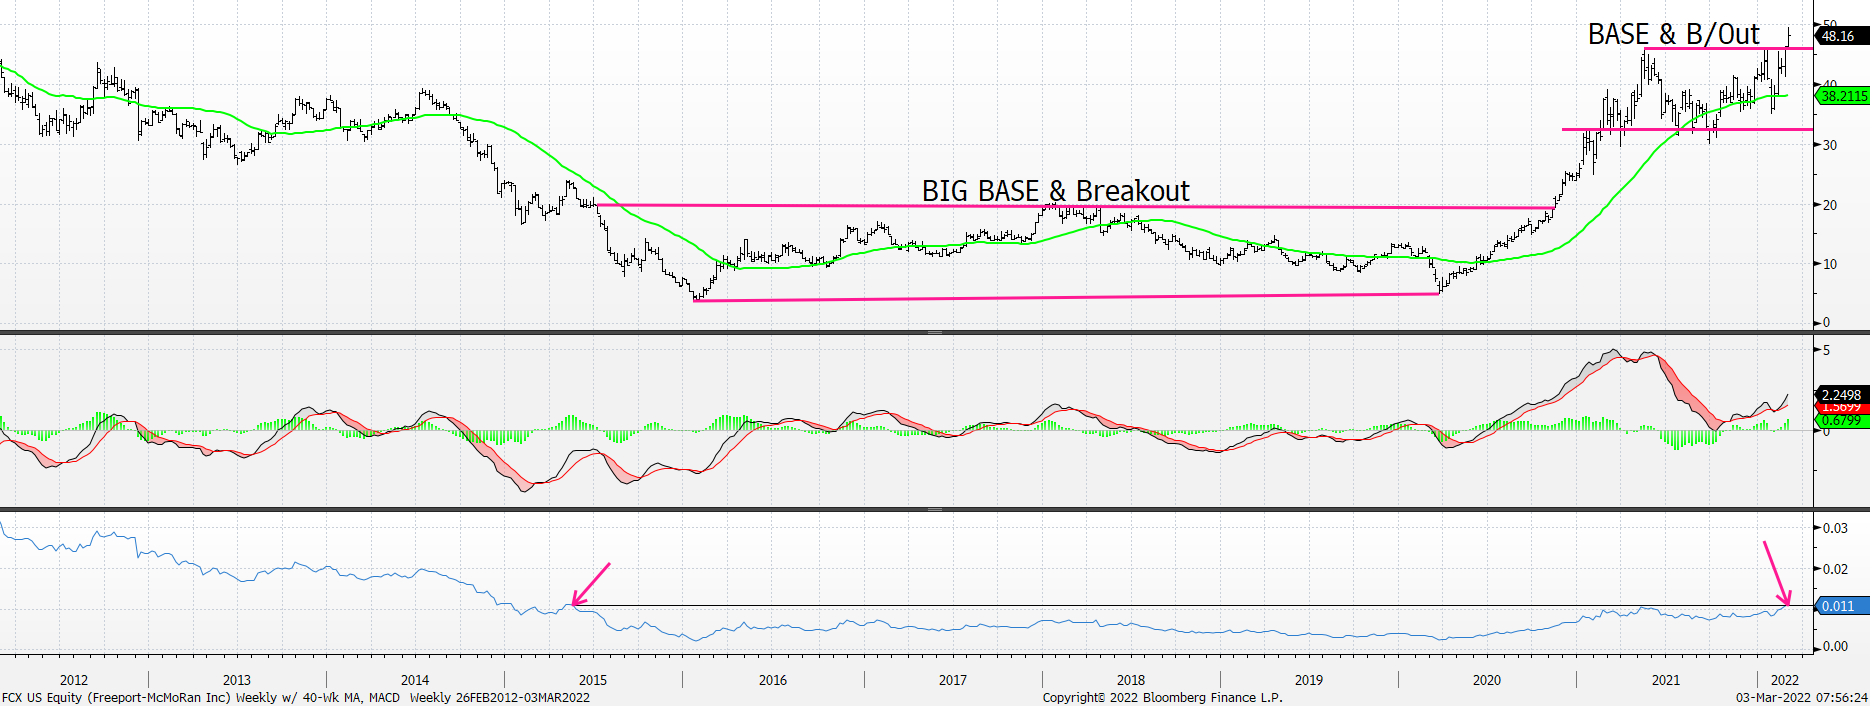
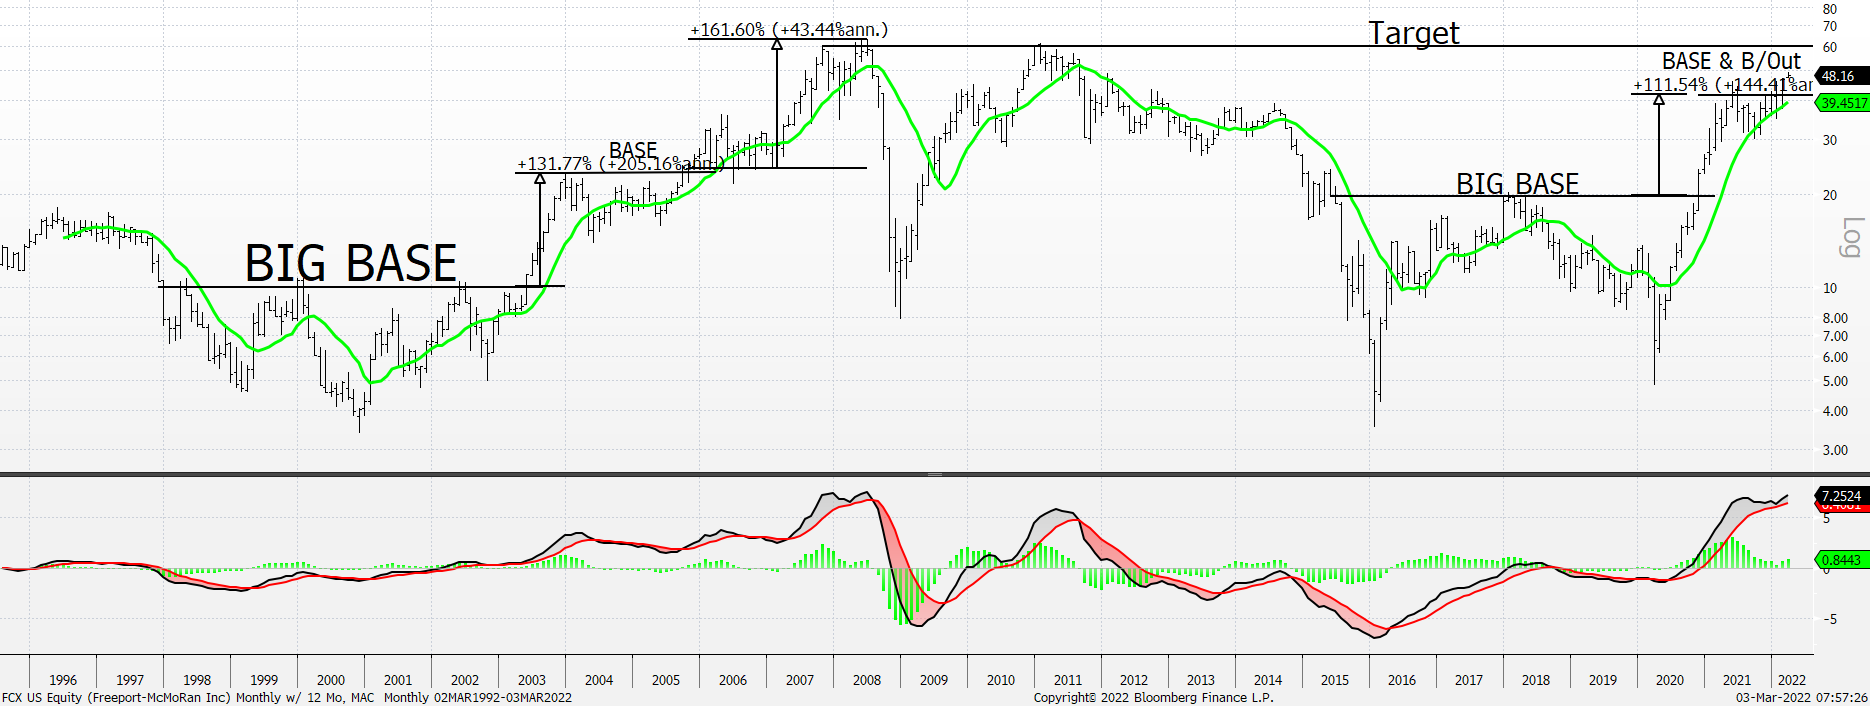
Our target of 60 for FCX (we’ve been lucky here and been pushing the stock since mid-November) is the “highest on the Street.” Kidding, of course, there’s no way that anyone monitors technical targets; but when compared to the fundamental analyst’s targets as compiled on Bloomberg, the 60 is above all others. It’s worth mentioning here that, like gold, FCX has been a BASE (sometimes a BIG BASE) and breakout stock since the early 2000s and post its prior breakouts the stock has gained (there are not a lot of examples, we know) +132%, +162%, and +112%. Freeport just completed its most recent BASE on February 25 when it closed above 46. If past is prologue, then our target of 60 is going to be way light.
The two charts below show FCX on a weekly and monthly basis. You’ll see quickly just why the stock gets a Technical Score = 4 on our work. And, please check the bottom panel of the first set of charts which shows FCX relative to the S&P which is at its highest level since May 2015.
Freeport-McMoRan – Weekly w/ 40-Wk Moving Average, Weekly MACD, and Rel. to S&P
Freeport-McMoRan – Monthly w/ 12-Month Moving Average and Monthly MACD
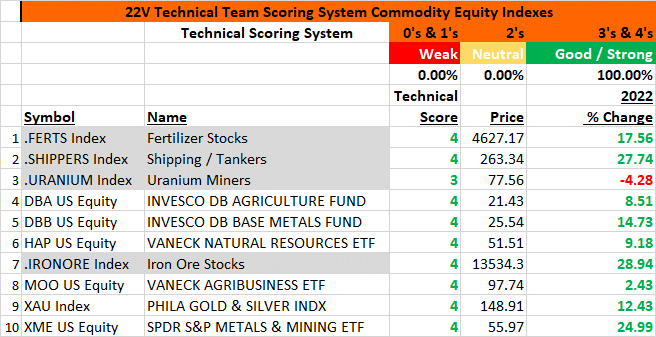
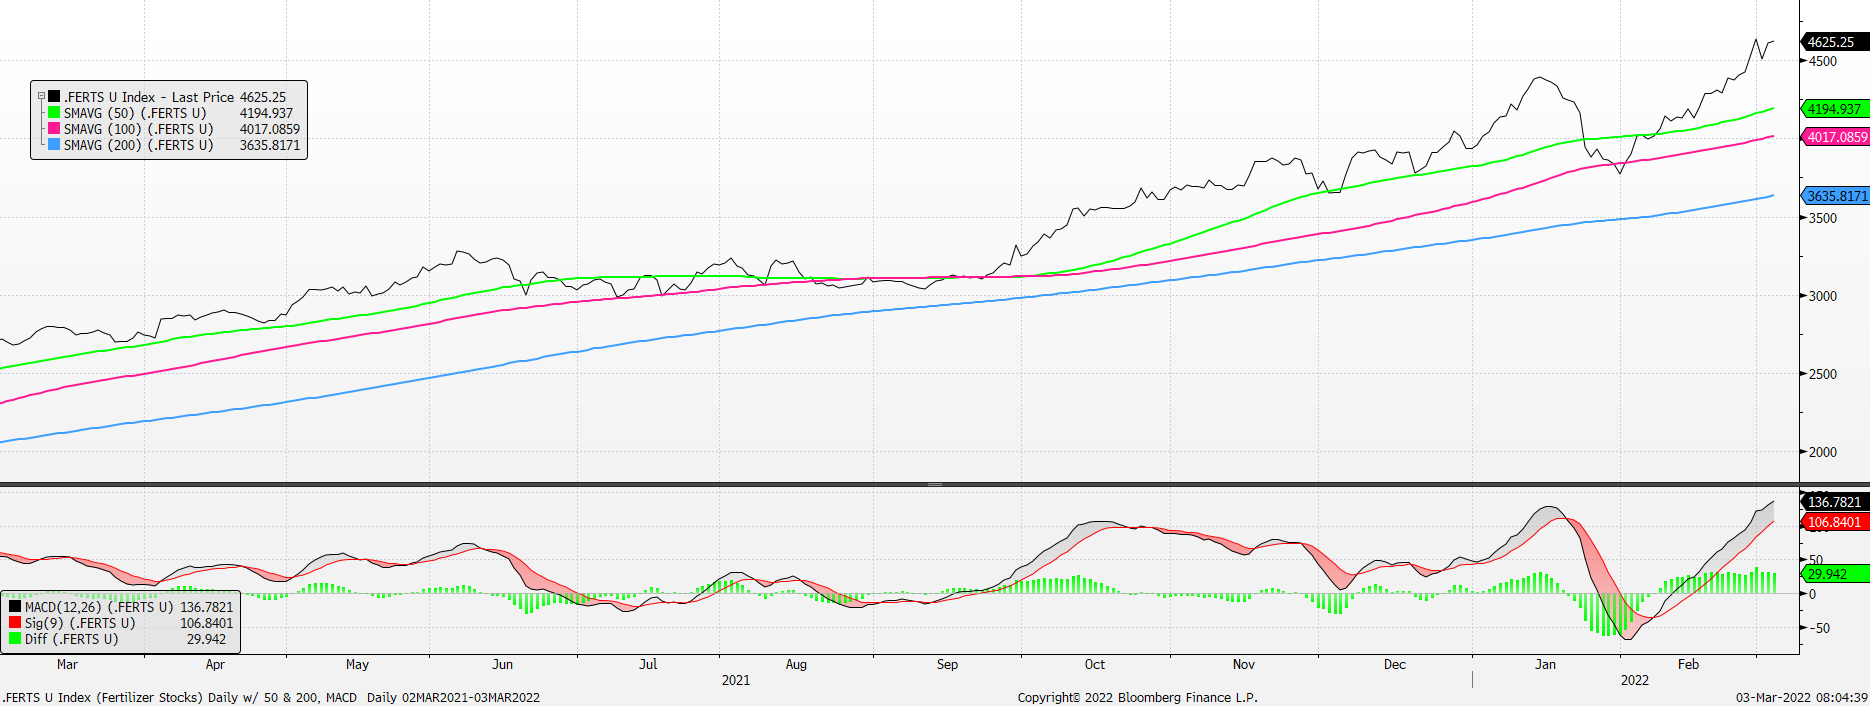
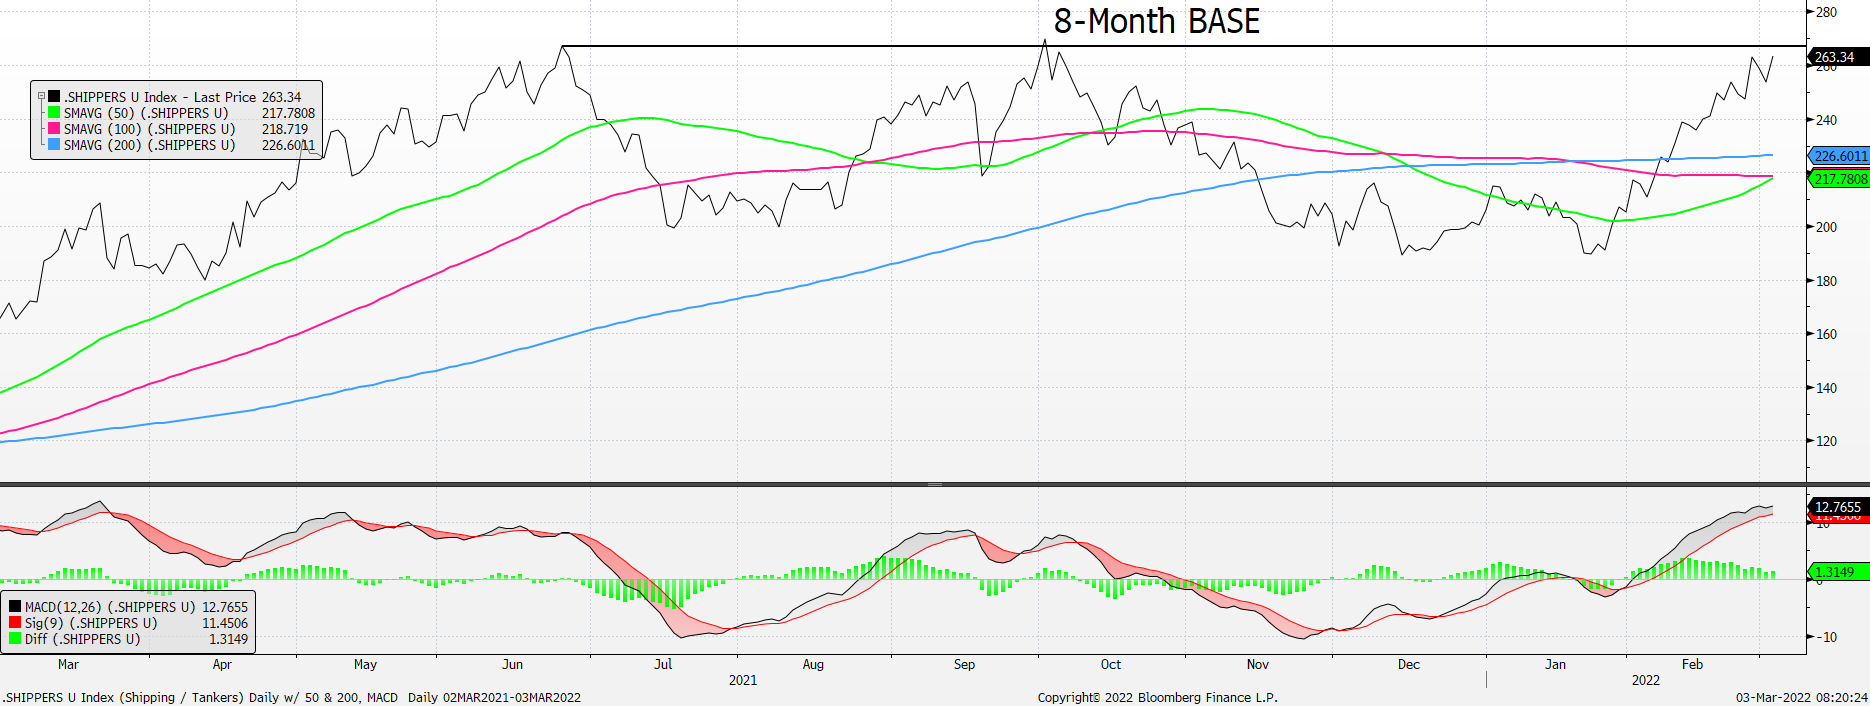
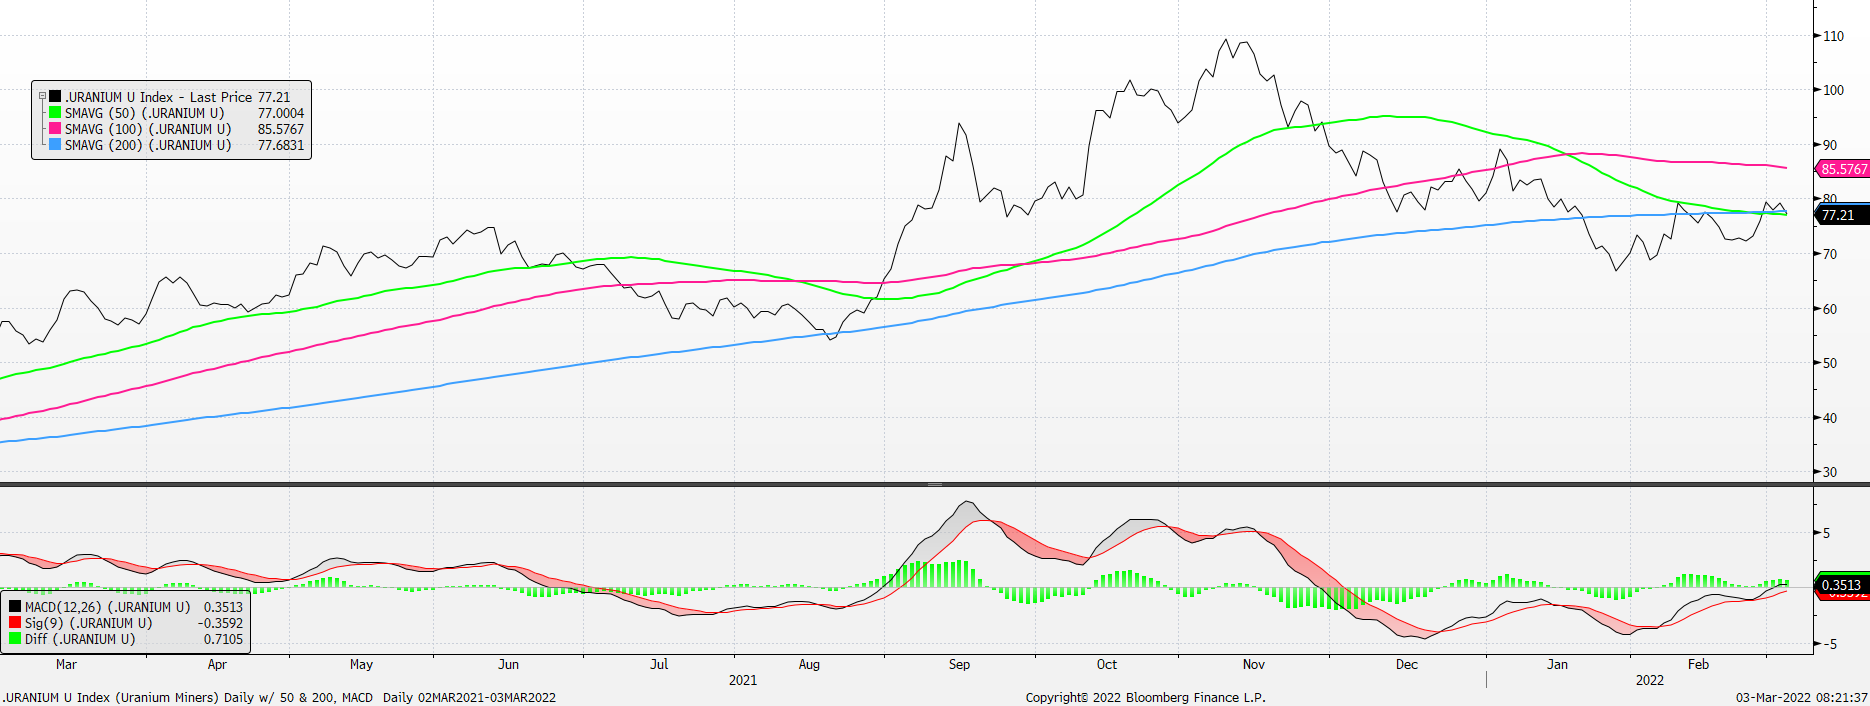
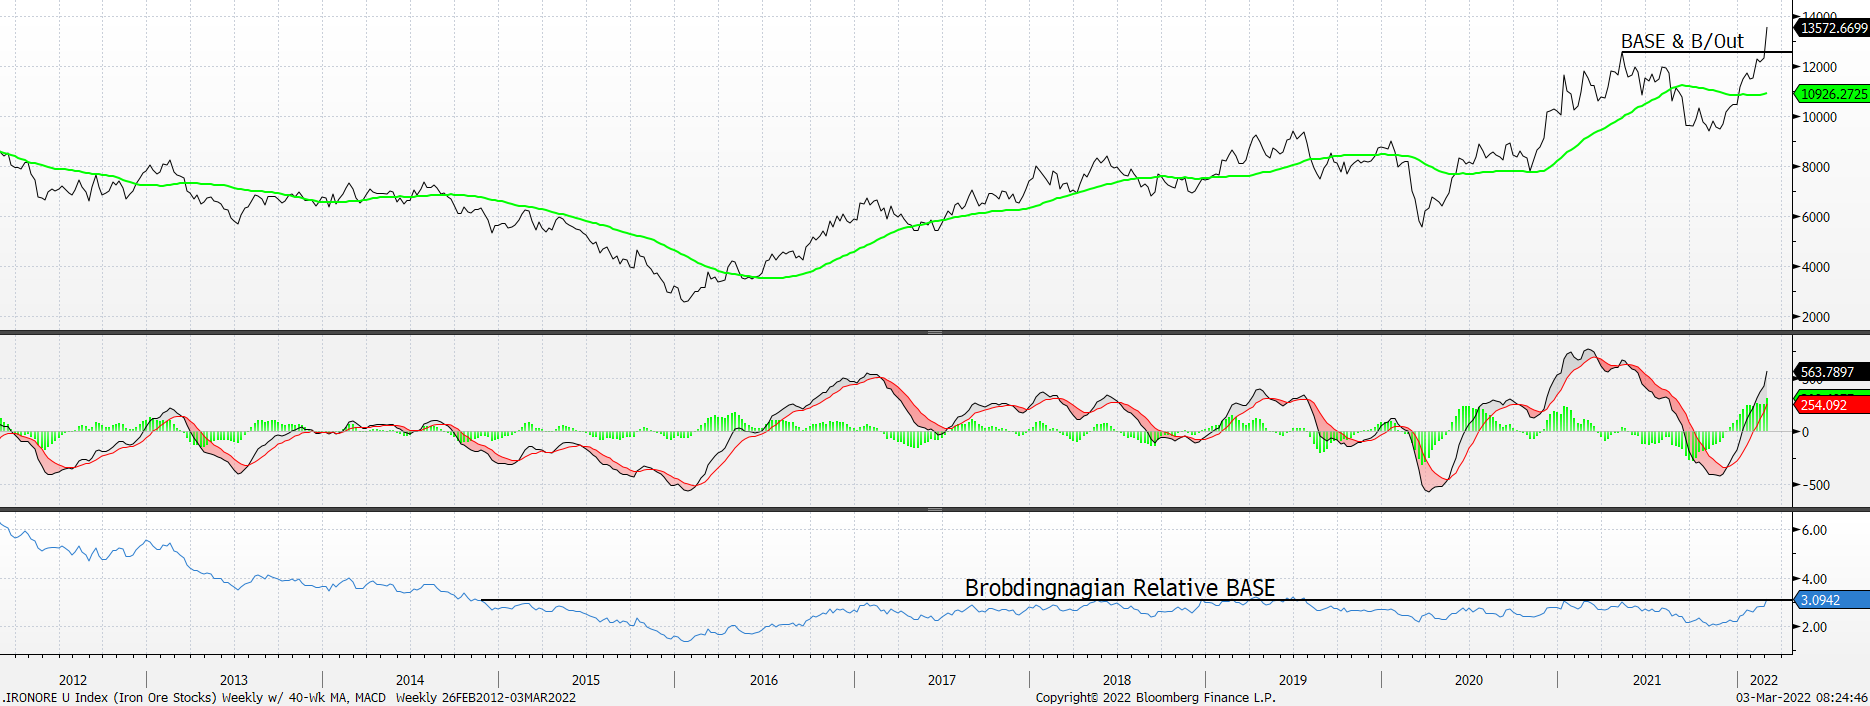
But the commodity equity strength extends beyond just Freeport-McMoRan. And by now, you might be tired of hearing it but we’re going to continue to go with it until it stops working. The table below shows 10 commodity related equity indexes and ETFs, and we promise we are not getting any residuals for highlighting the Invesco and VanEck offerings. The indexes grayed out are our own and they continue to be helpful in monitoring the respective sectors. What’s immediately apparent is that there is a clean sweep across the Scorecard as all 10 have high Technical Scores = 4. Charts for our indexes follow below the table. Let us know if you want to see the constituents for our indexes.
Fertilizer Index – Daily w/ 50-, 100, and 200-Day Moving Averages and Daily MACD
Shipping / Tankers Index – Daily w/ 50-, 100, and 200-Day Moving Averages and Daily MACD
Uranium Index – Daily w/ 50-, 100, and 200-Day Moving Averages and Daily MACD
Iron Ore Stocks Index – Weekly w/ 40-Week Moving Average, Weekly MACD, and Rel. to S&P
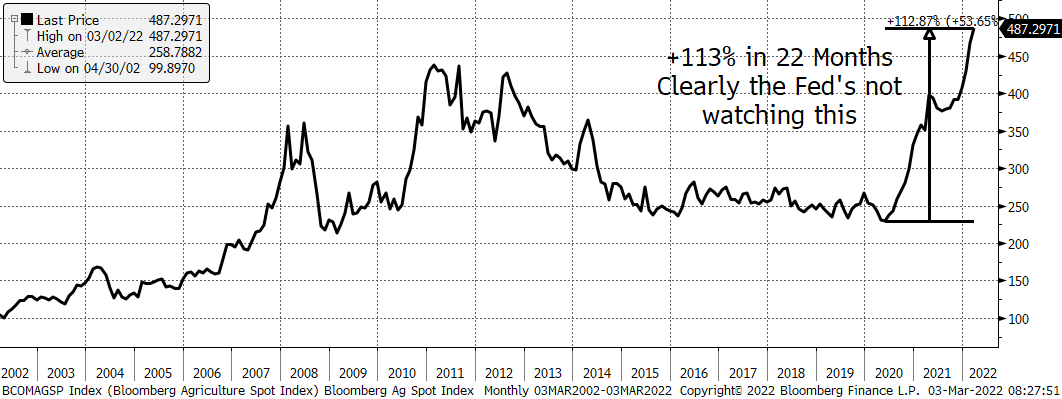
Bloomberg Ag Spot Index – Monthly