
Our entire repository of COVID charts can be found HERE.
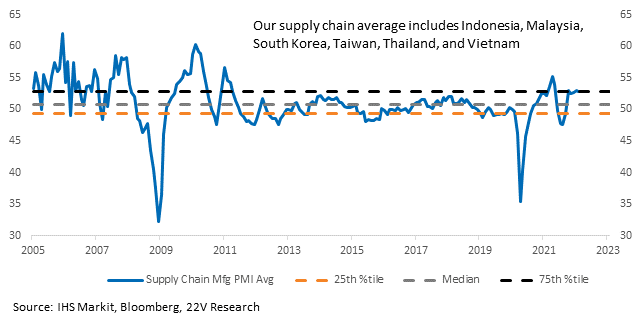
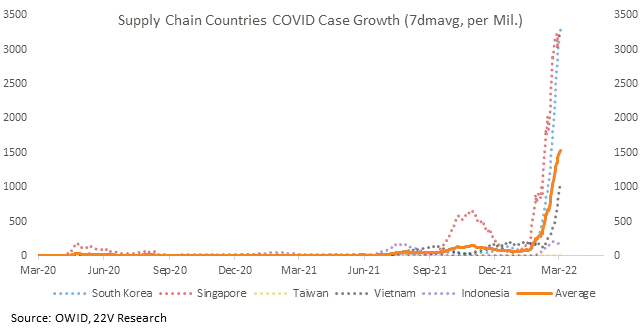
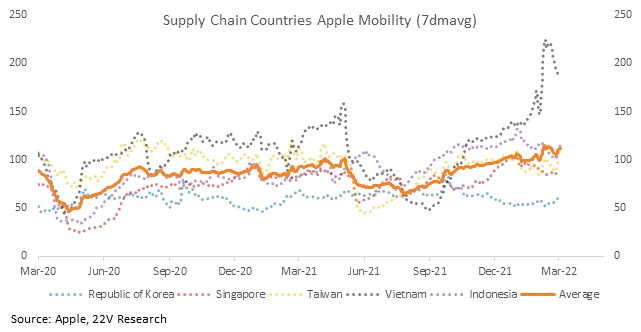
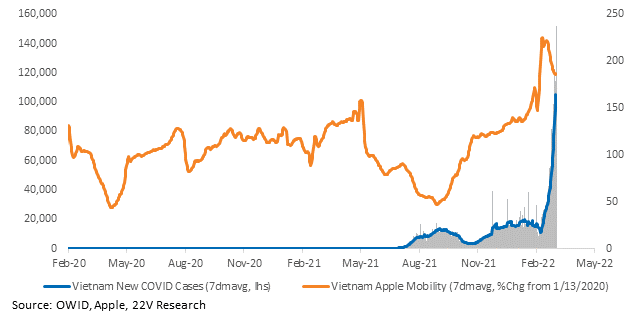
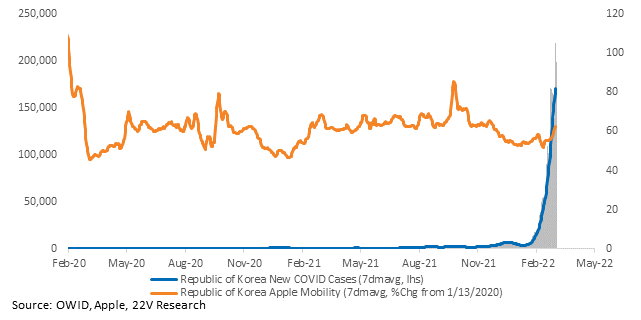
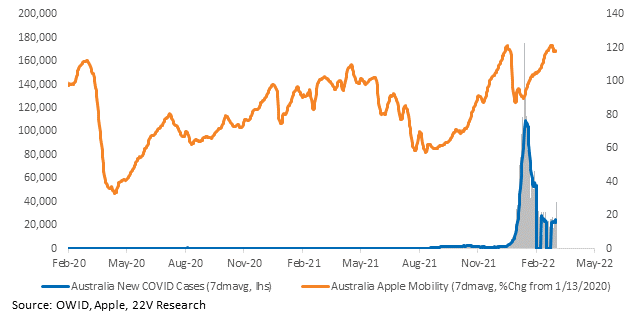
Supply chain sentiment has turned positive. The Omicron wave in important supply chain countries has not been as disruptive as initially assumed/feared. As we detail later in this report, case growth is still accelerating, but countries are resistant to lockdowns and mobility has been resilient.

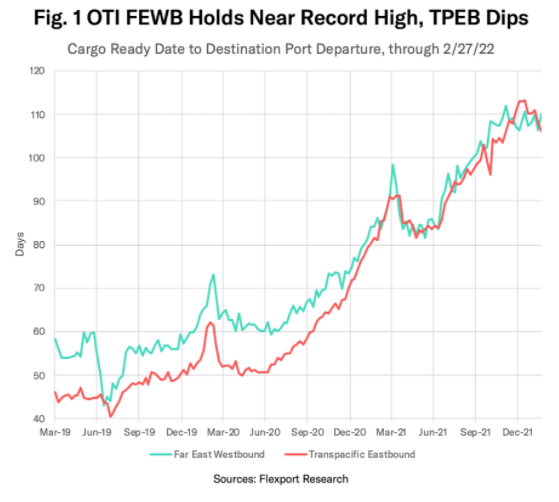
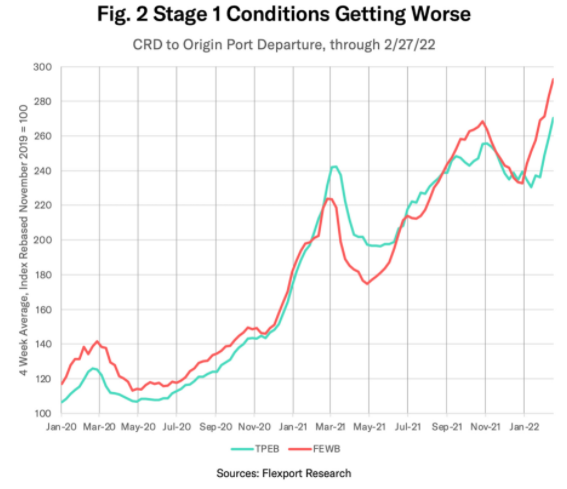
Supply chains have not yet realized improvements, however. Flexport’s Ocean Timeliness Index – which measures the amount of time taken to ship freight from the point at which cargo is ready to leave the exporter to when it is collected from its destination port – is near its record. The metric for ‘stage 1 conditions’ – which measures bottlenecks early in the journey – is at a record. Per the Flexport folks, “That would suggest bottlenecks for newly-departed cargoes have worsened and that the improvement in total handling times may prove short lived.” Flexport’s research department puts great supply chain indicators together and we suggest everyone go check them out. Ideally, sentiment leads improvements, which would in turn alleviate pressure on goods inflation.
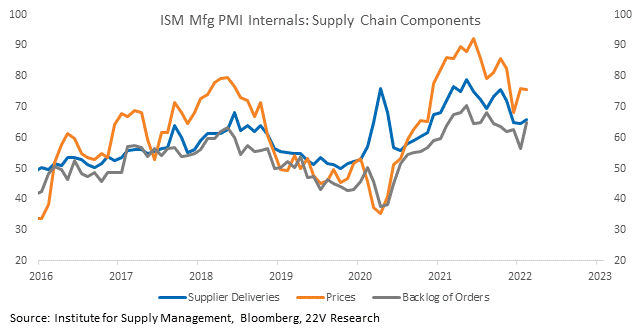
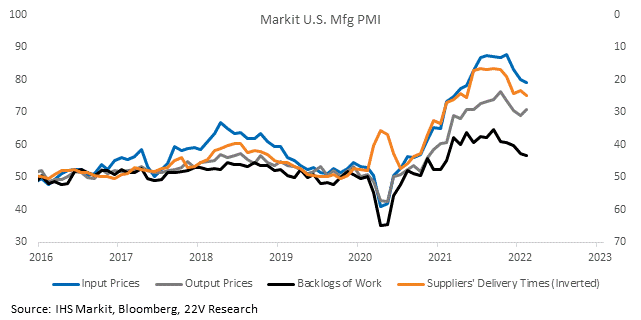
PMIs released this week didn’t show meaningful changes in supply chain conditions in February. Supplier delivery times, prices, and backlogs of orders in the US were all pretty flat. Headline PMIs in important supply chain countries were flat too.
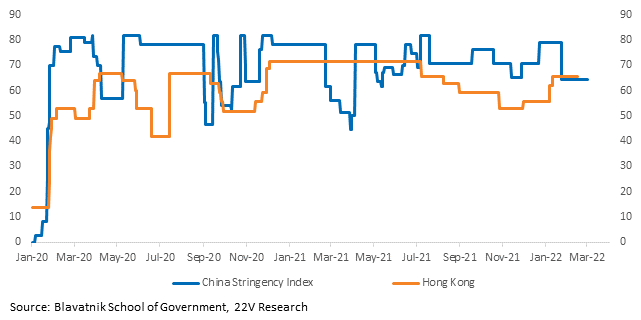
China is exploring alternatives to its zero-COVID policy. Policies like travel bubbles, new antiviral drugs, and vaccines will help China create its own version of living with the virus. The changes won’t be immediate, but it’s encouraging longer term.
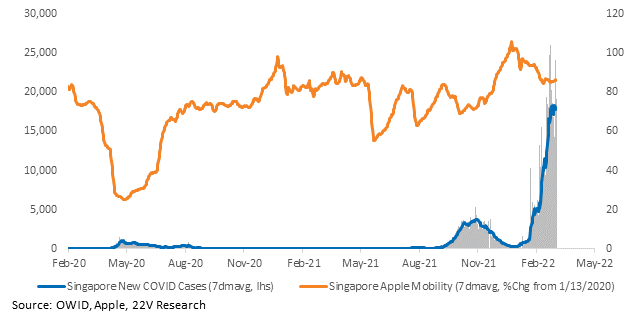
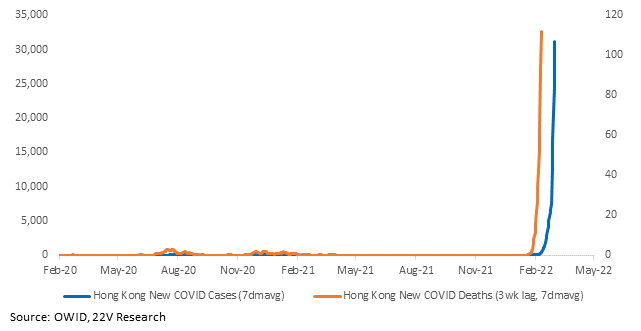
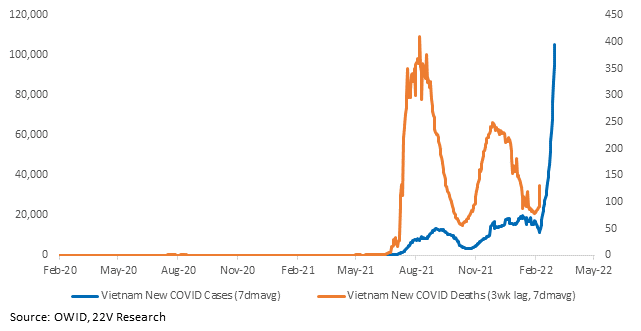
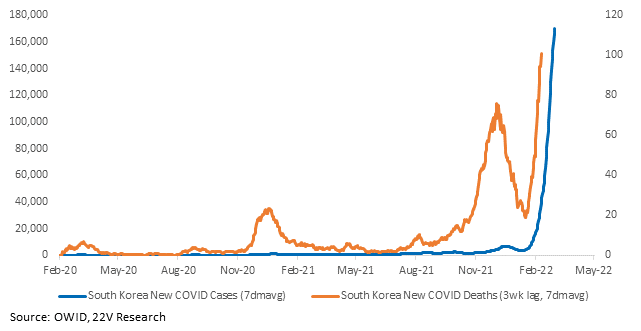
COVID case growth in important supply chain countries is accelerating. Cases are much higher in South Korea, Singapore, and Vietnam. But severe cases are low enough to avoid major disruptions. This is the key. As long as hospitalizations and deaths are manageable, it appears lockdowns are unlikely even in regions that are more apt to lock down.
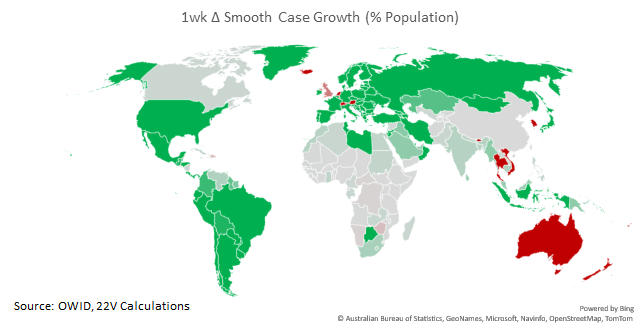
COVID case growth is significantly better globally.
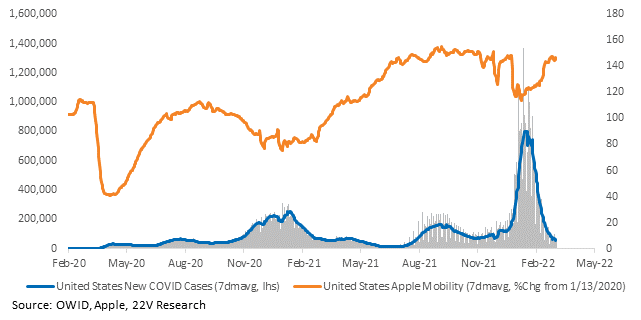
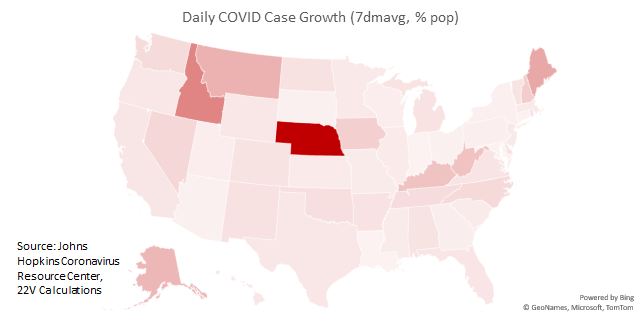
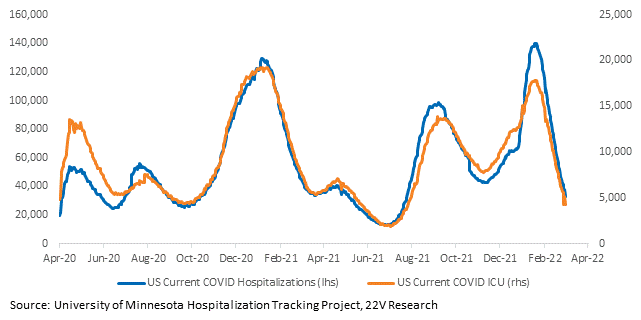
And the U.S. is in great shape.
Charts for every state and country we have data for are HERE.

