Sell / Reduce – Asset Managers & Investment Banks
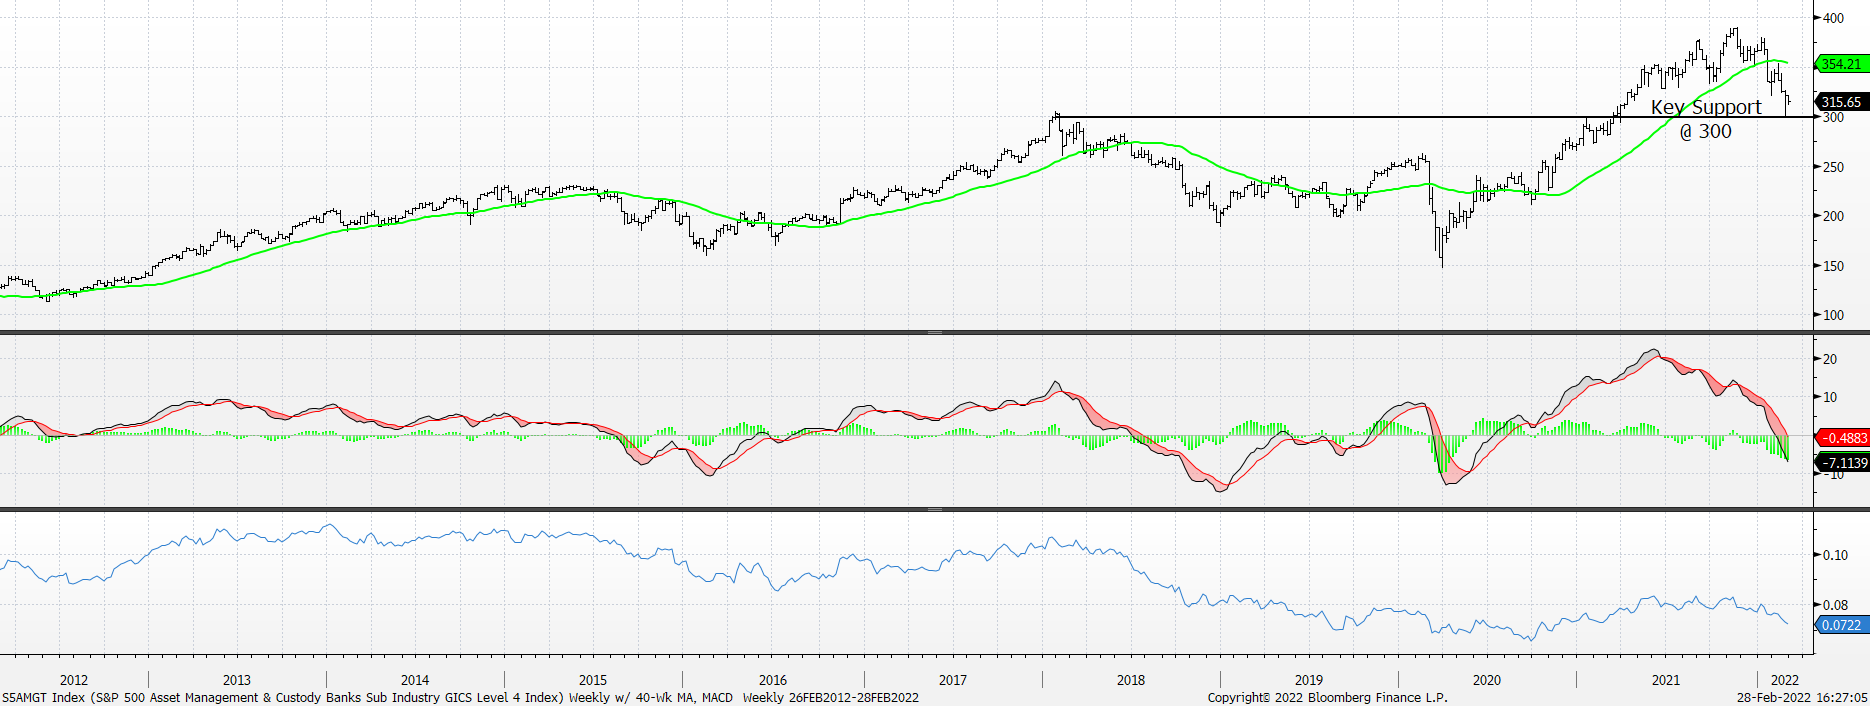
S&P Asset Management & Custody Banks Index w/ 40-Wk MA, Weekly MACD & Rel to S&P 500: Technical Score = 1
Technicals are negative across the board for this index as it is below its downward-sloping 40-week moving average, weekly momentum is in negative territory, and relative price action vs. the S&P is also weak. The group / Index has key support @ 300. A break of that level, which we think happens, will imply a first target of 250.
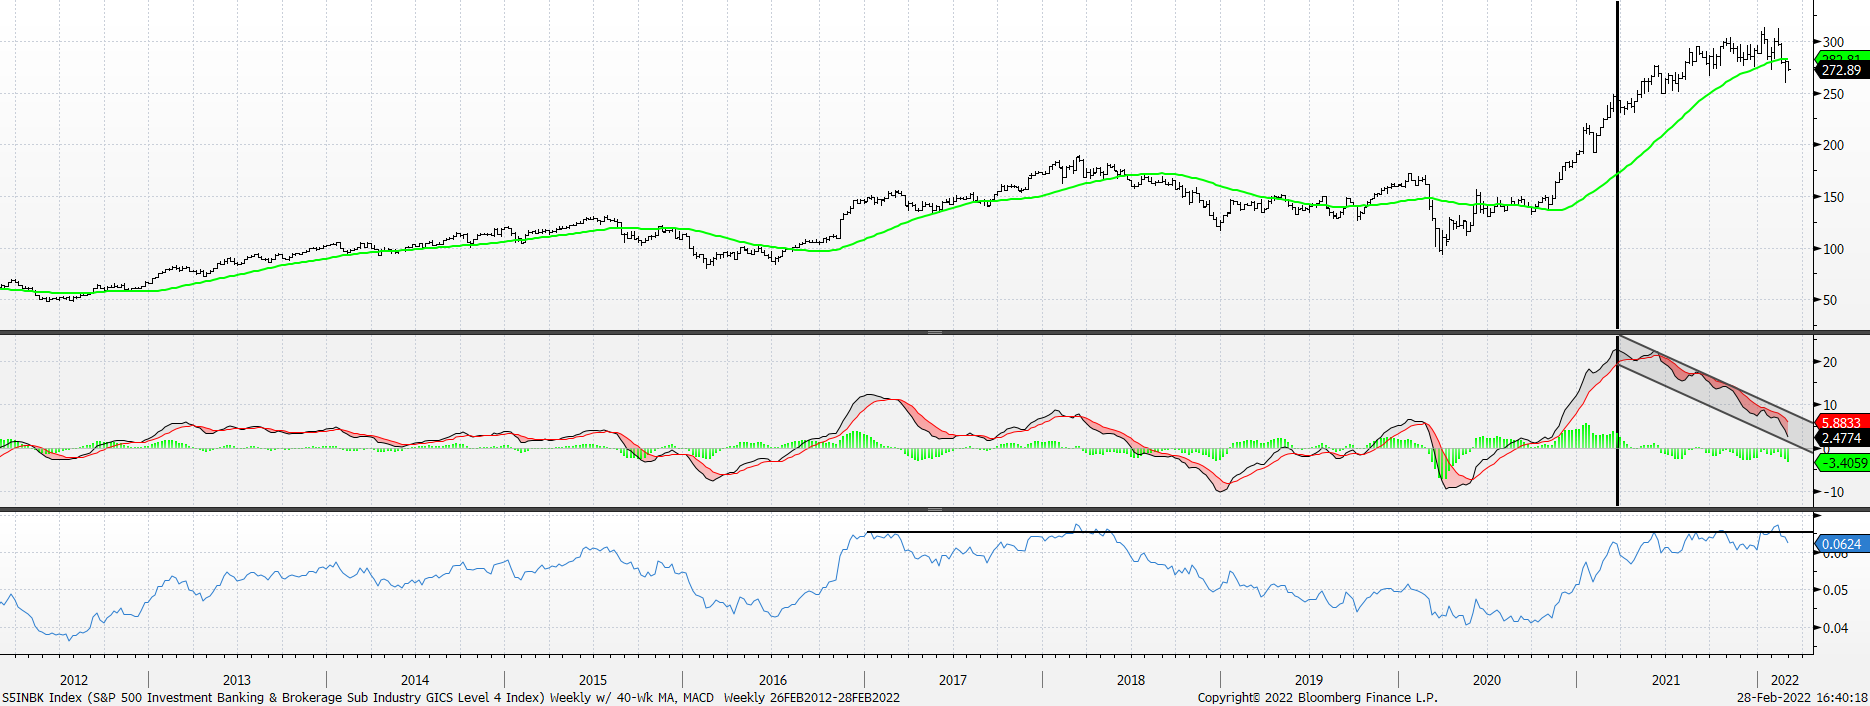
S&P Investment Banking & Brokerage Index w/ 40-Wk MA, Weekly MACD & Rel to S&P 500: Technical Score = 1
Though the Technical Scores are the same – poor –, it looks to us like Investment Banking group has more risk near-term. Its cresting 40-week moving average is resistance to upside action, its weekly MACD is working on a near 12-month negative divergence and relative price vs. the S&P 500 is also into resistance going back to 2017.
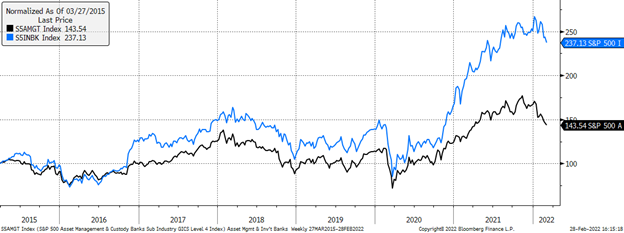
Both the Asset Management and Investment Banking Indexes are shown here with weekly closing prices, normalized to 100, back to late March 2015. Topping price action is clear.
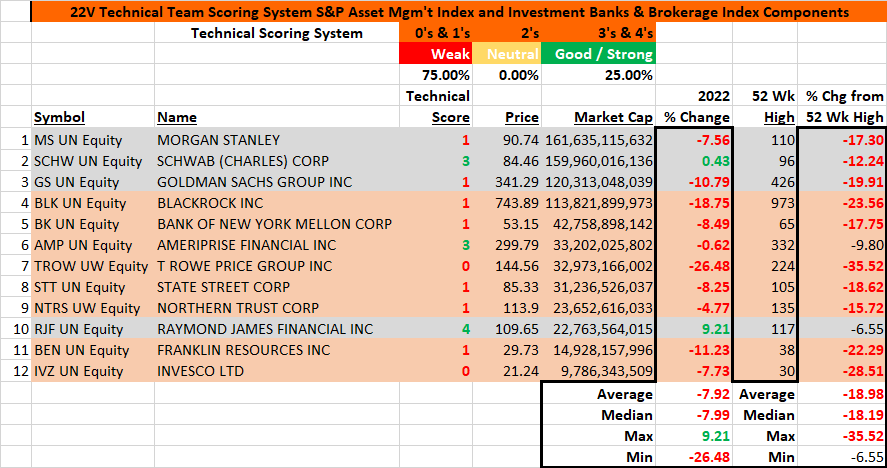
We’ve taken the stocks from both Indexes and Scored them using our Technical Scoring System. The list is sorted by market cap and the salmon-colored highlights are for the Asset Management & Custody Banks stocks while the gray-colored highlights are for the Investment Banking & Brokerage stocks. Their Technical Scores are overwhelmingly poor as is their % change from their respective 52-Week Highs. Too, nearly all are down so far in 2022. Charts for MS, GS, and BEN follow below. Also, though JP Morgan is not in this group we’re including a chart for it, too.
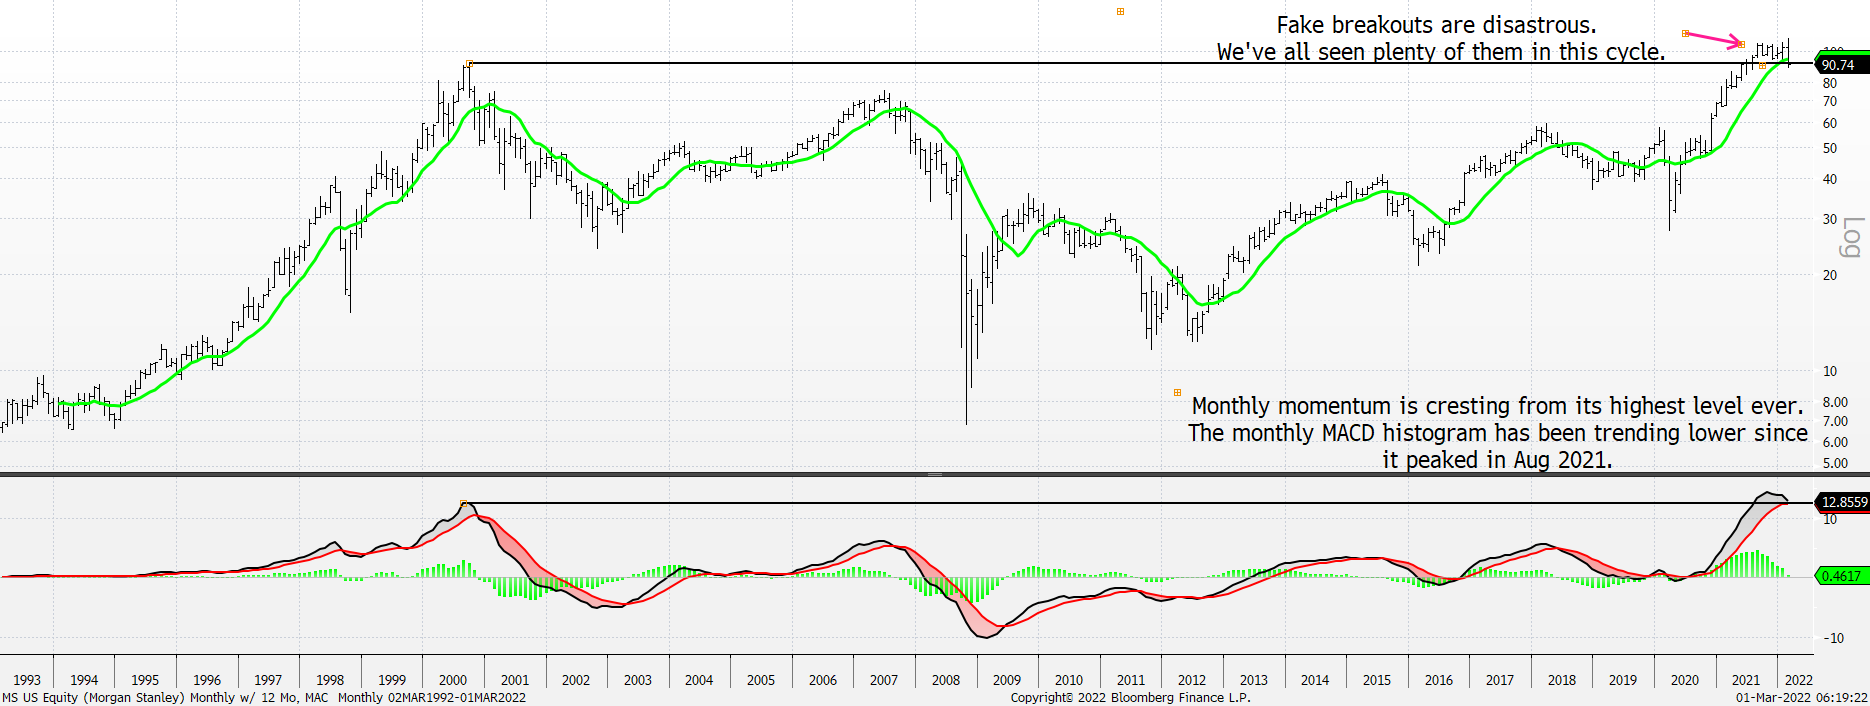
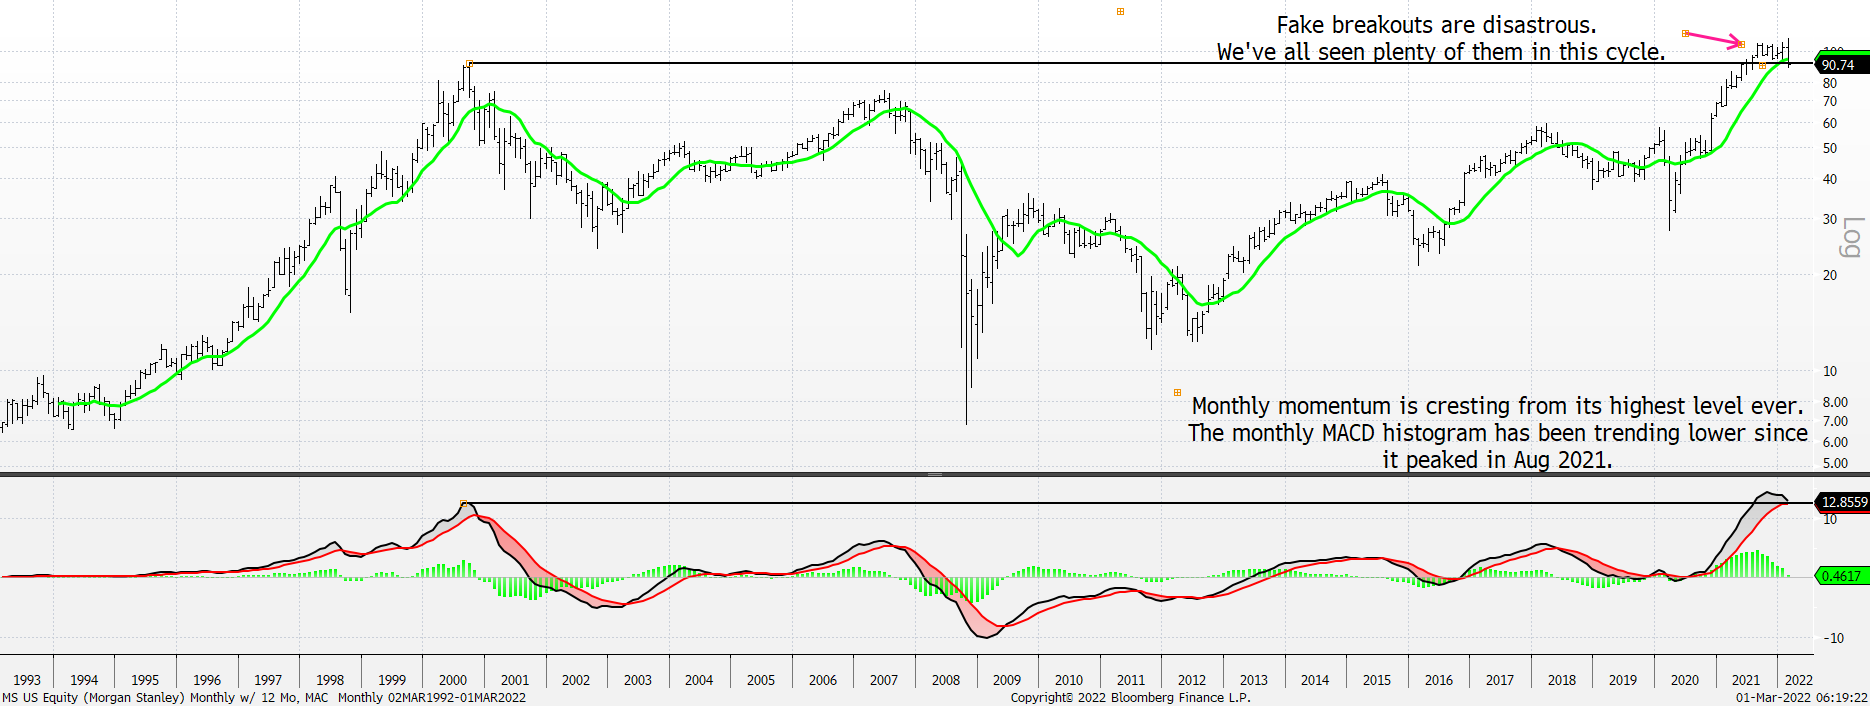
Morgan Stanley – Monthly w/ 12-Month Moving Average and Monthly MACD
Goldman Sachs – Monthly w/ 12-Month Moving Average and Monthly MACD
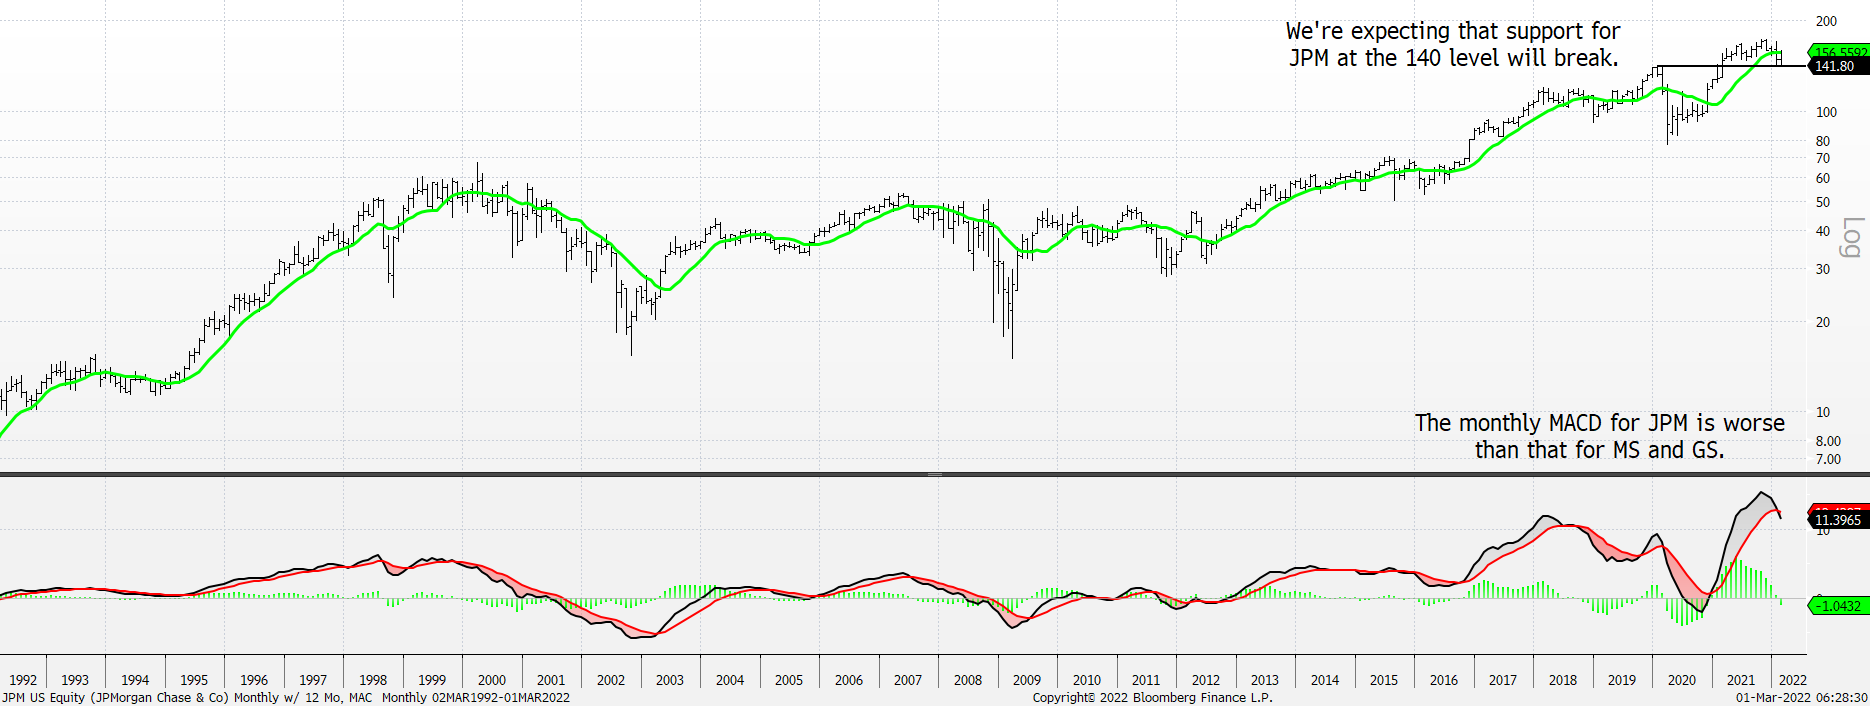
JP Morgan – Monthly w/ 12-Month Moving Average and Monthly MACD
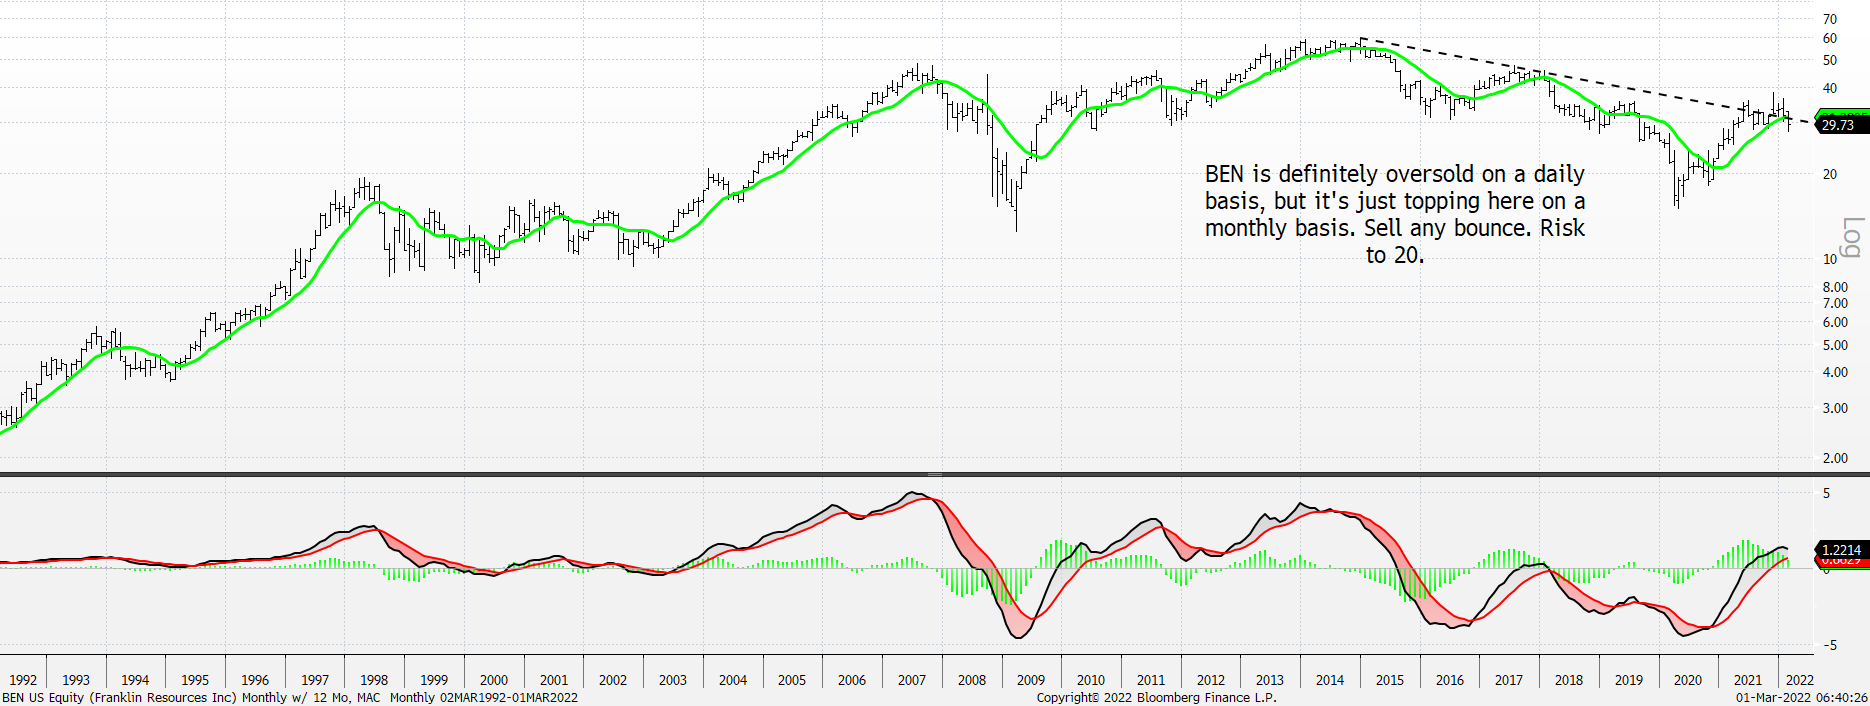
Ben Franklin – Monthly w/ 12-Month Moving Average and Monthly MACD