
Our entire repository of COVID charts is HERE.
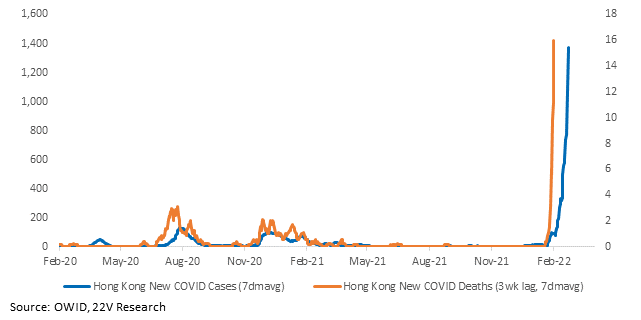
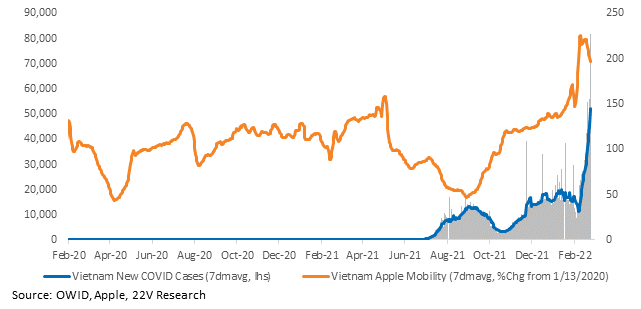
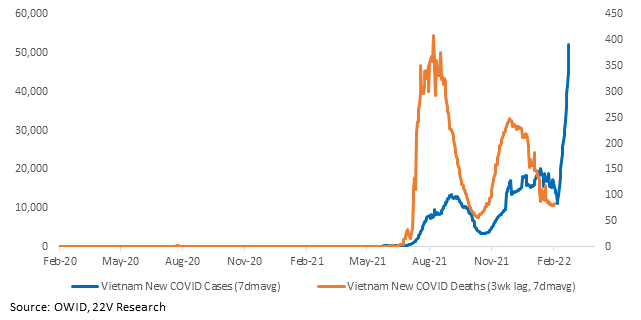
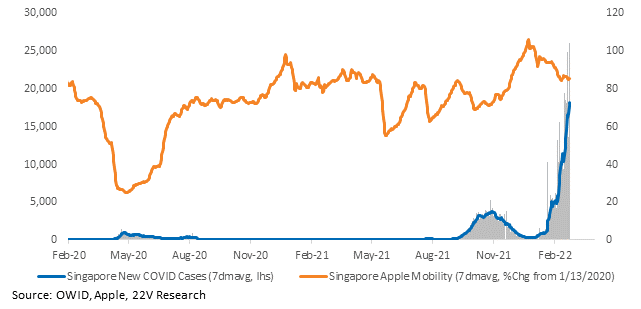
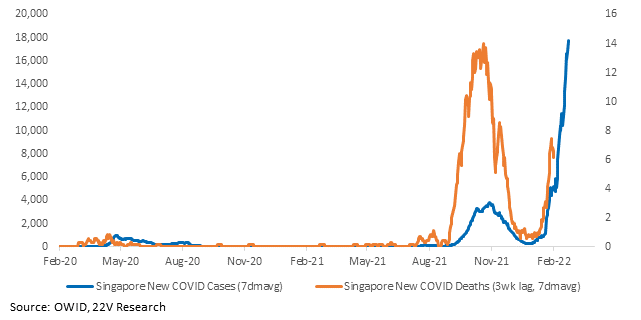
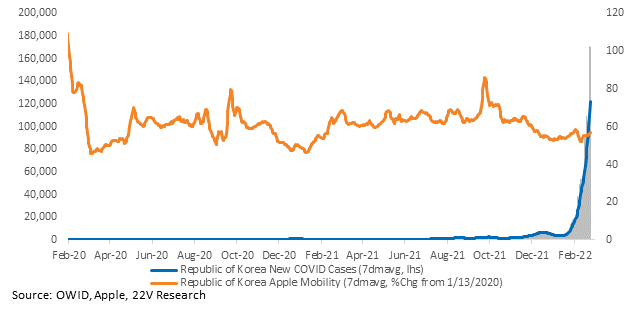
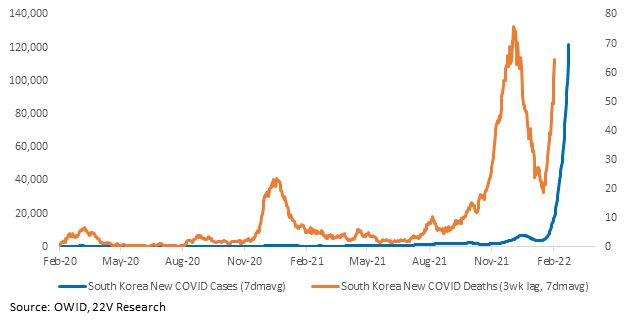
Supply chain sentiment continues to improve despite the acceleration of COVID case growth in important supply chain countries. Mobility in the region has rolled over but is still at a high level. Governments have so far been reluctant to impose severe restrictions, in part because serious infections and deaths remain at low levels. Cases aren’t pressuring health care systems, which is making the affect on supply chains, so far, less than feared.

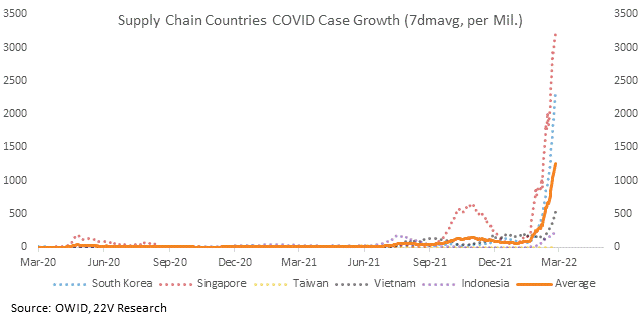
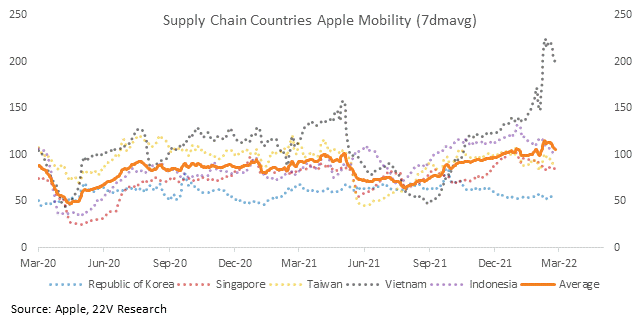
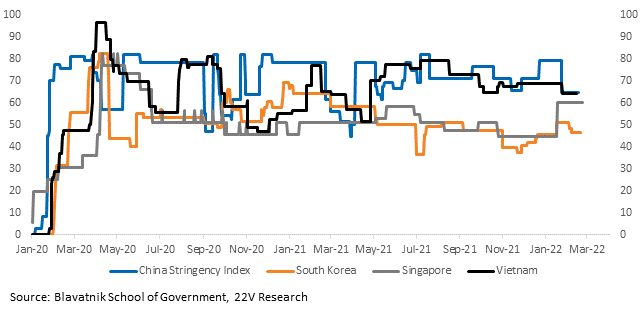
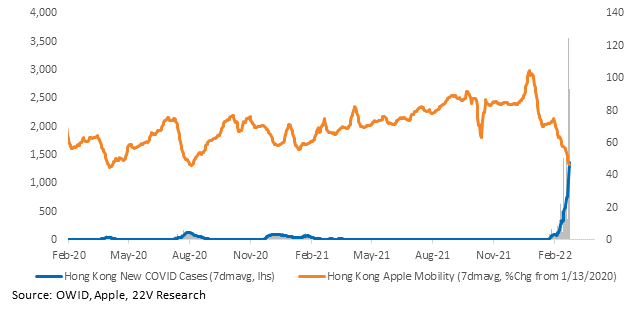
The worst case growth is in Hong Kong, Vietnam, Singapore, and Korea. Mobility has declined ex-Korea, which is somewhat concerning, but severe cases remain exceptionally low. The lack of severe cases should support a recovery in mobility.
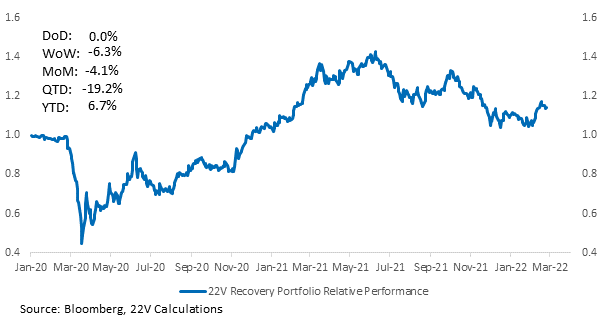
Recovery portfolio performance had improved before the Russia-Ukraine tensions spiked as activity picked up following the Omicron wave and investors were comfortable with an “immaculate tightening.” But the portfolio will suffer in risk-off environments. Longer-term, the factor exposure is poor for a backdrop of tighter financial conditions and rising real rates. The conflict in Ukraine muddles the outlook for central banks, but it will tighten financial conditions on its own.
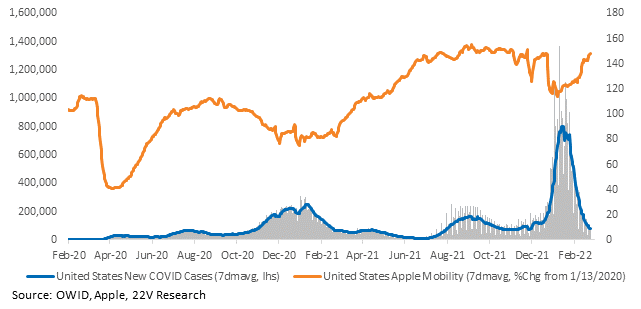
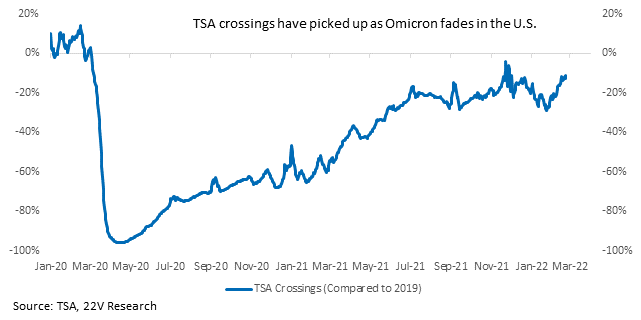
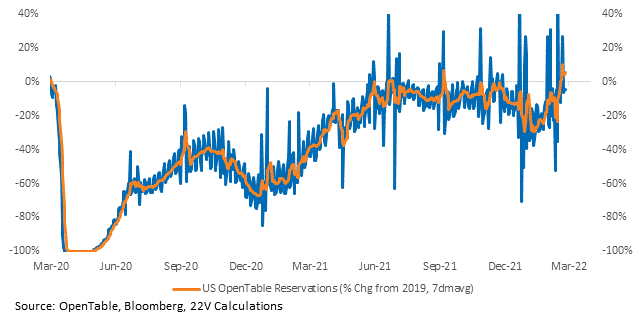
Mobility continues to increase in the US. COVID-sensitive industries are recovering too; TSA crossings are increasing and OpenTable reservations have hit a post-pandemic high relative to 2019 levels.
Charts for every state and country we have data for are HERE.

