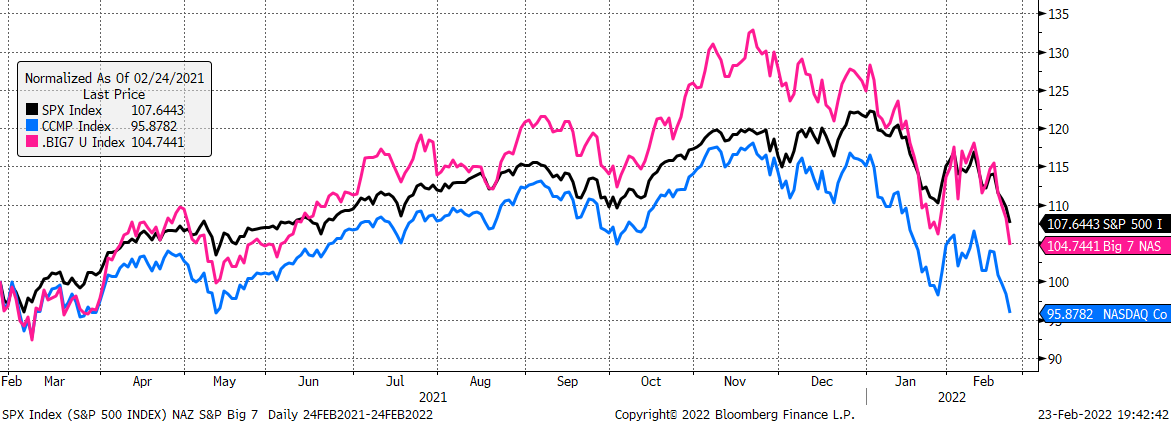
Bear market tops are drawn out procedures where the weakest and most speculative links in the chain go down first. The strongest links in the chain eventually participate on the downside, like we’re seeing now with our Big 7 Index, and when they do their weighty moves lower push the indexes below key support levels and the decline picks up speed. With the now obvious underperformance by theBig 7 Index [our index was -3.2% today vs. -1.8% for the S&P and vs. -2.6% for NASDAQ; our index is -21% since its peak on Nov 19, 2021, vs. -10% for the S&P and -18.8% for NASDAQ], it is now crystal clear that what was the market’s greatest strength as it rallied has now become the market’s greatest weakness as it falls.
S&P (black), NASDAQ (blue), and the Big 7 (pink, AAPL+AMZN+FB+GOOGL+MSFT+NVDA+TSLA)
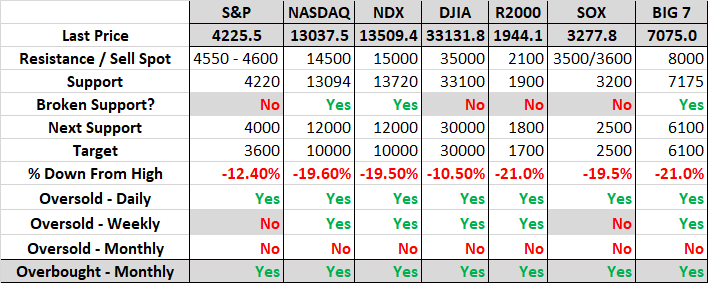
As if the action isn’t difficult enough, the following table will likely emphasize why we went with the “Neat it Ain’t” title. Please concentrate on the following rows:
Broken Support? – You can see quickly that while there’s been a lot of pain, it has been centered in the NASDAQ, NDX, and the Big 7 as these are the only three indexes that have broken support levels we’ve been using. The S&P, DJIA, R2000, and SOX are getting closer to breaking their respective support levels, but this little observation would suggest that the market is not as washed out as most believe.
% Down From High – Again, downside pressure has been most acute in the NASDAQ, NDX, R2000, SOX and the Big 7. It’s pretty amazing to us that despite the SOX being down 20% from its high it is not yet below its support level. We’ve reviewed the data and chart history for the SOX back to 1995 and its median historical bear market is -39%. If this is a decent guide, then you’ll understand why our SOX target is 2500. As to the S&P and DJIA, so far, their losses of -12.4% and -10.5%, respectively, might be historically referred to as “corrections” as they haven’t yet declined the requisite 20% to be termed bear markets.
Source: 22V Research
Oversold – Weekly – Weekly oversold readings are not yet there for the S&P and SOX, but it’s going to happen.
Oversold – Monthly – Not one is close to being oversold on a monthly basis. But, more amazingly, we find that…
Overbought – Monthly – All of them are still overbought on a monthly basis. These momentum readings are certainly a function of how strongly each of the indexes were from 2019 – 2021 as monthly win rates were as high as 77% (the SOX gained in 28 out of 36 months). Just as the overbought readings were a function of both price and time, we believe that to achieve – though there’s no certainty it will happen – oversold readings. However, if oversold readings are to develop in our monthly charts, then it will also be a function of both price and time.
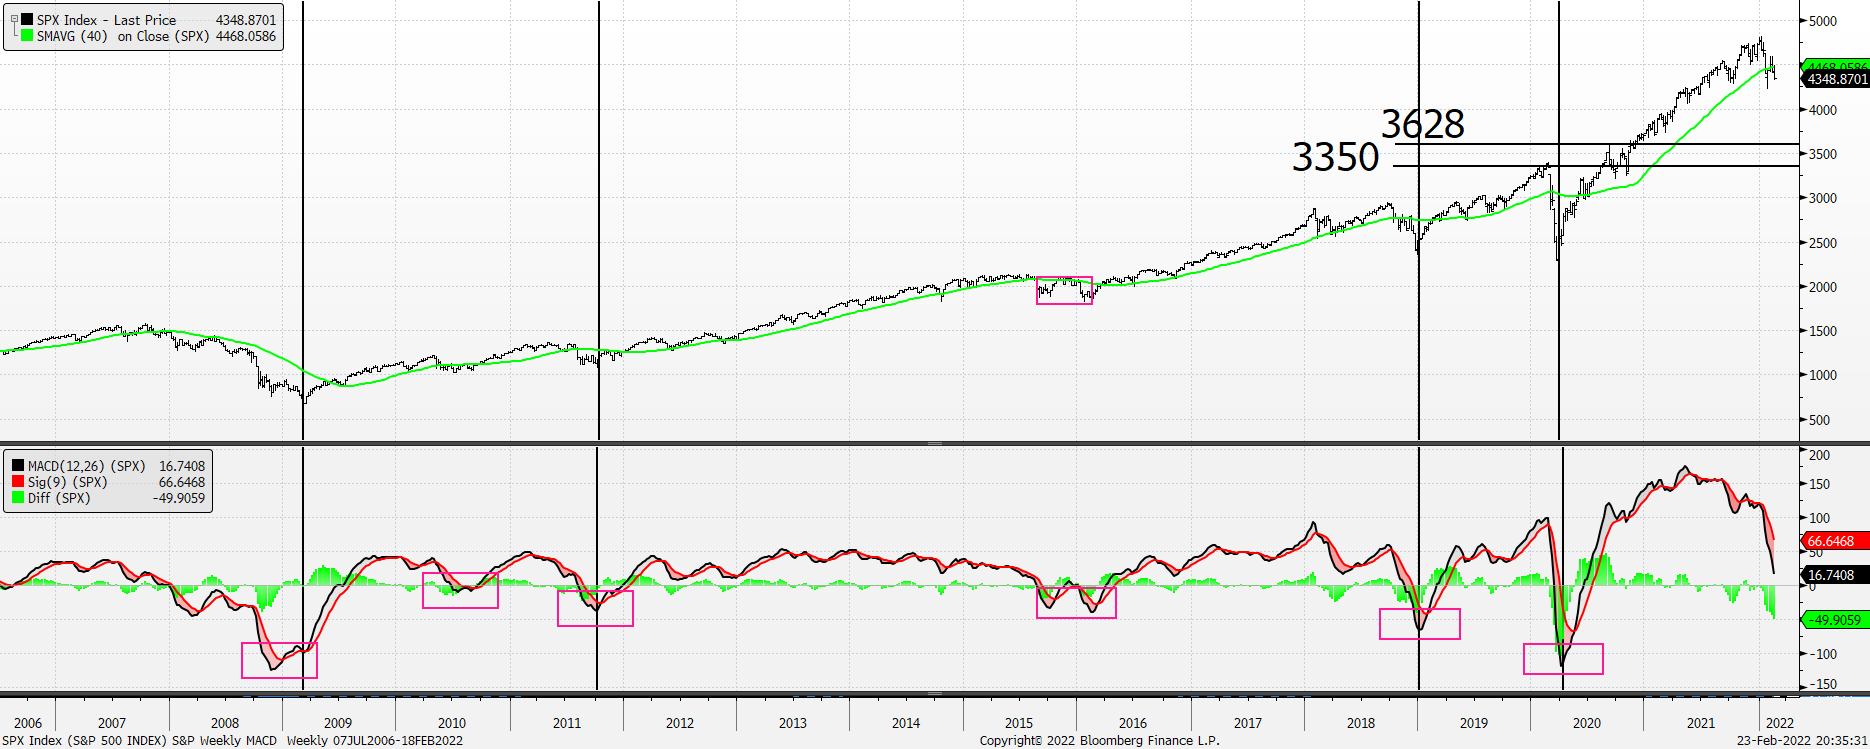
In short, we expect the S&P, DJIA, R2000 and SOX will break their support levels, we believe all will record weekly oversold readings, and we still expect that most stocks and indexes will get back to their post-COVID low breakout levels which correspond, for the most part, with our downside targets found in the table above. The weekly chart below is for the S&P. Please notice that deep oversolds occurred in 2008-2009, 2018 – 2019, and 2020 while less extreme oversolds were seen in 2010, 2011 – 2012 and 2015 – 2016. We’re guessing the one on the docket will be like the deep versions.