Those old English proverbs (a redundancy, we know) got right to the point, didn’t they?
Gold is up nicely again today, for the third time this week, and for the 11th time in the last 14 days. Sure, the metal doesn’t bounce enough to make anyone’s Top 10 list but slow and steady ultimately makes an impression on you.
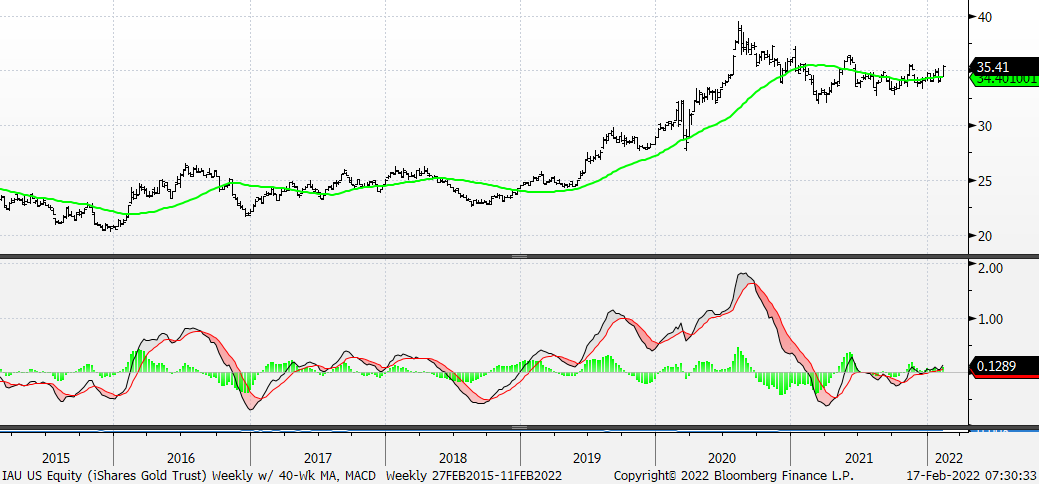
IAU – iShares Gold Trust Weekly w/ 40-Week Mov Avg and Weekly MACD We continue to believe that gold will make a new all-time high and the same is true for the IAU. Given gold’s early morning advance we’ll all see the IAU gap up at the open but that should not dissuade potential buyers because it, like gold, is not yet even above its spring 2021 high. The real breakout will occur there – 1916.64 for gold and 36.375 for IAU – but we’re confident it will happen. Also, you might have to squint to see it but the 40-week moving average for the IAU is slowly sloping upward and the weekly MACD in the lower panel has moved politely into positive territory. Momentum has been so meek as to believe nobody is late on IAU here.
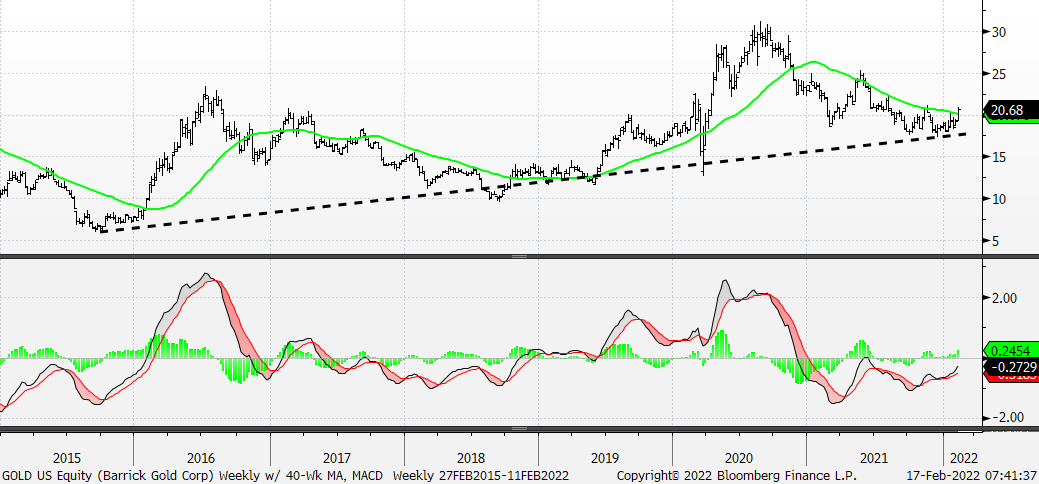
GOLD – Barrick Gold Weekly w/ 40-Week Mov Avg and Weekly MACD
Barrick cleverly changed their symbol some time ago from ABX to GOLD which makes it easy for us to remember. It’s true that gold the metal and IAU are ahead of GOLD the stock. But we believe there’s almost no way on God’s green earth that gold the metal will make a new all-time high and GOLD the stock won’t participate in a big way. If it’s true that you are not late on gold the metal, then it is even truer that you are not late on GOLD the stock. We believe GOLD the stock will work to 40.
The trendline in the chart here is not perfect but we’ve included it to emphasize that GOLD the stock is making a higher low vis-à-vis its 2020 low (which was higher than its 2019 low which was higher than its 2018 low which was higher than it 2015 low…you get the point). We also want to point out that while GOLD the stock was moving lower throughout 2021 its Weekly MACD was moving higher providing a positive momentum divergence.
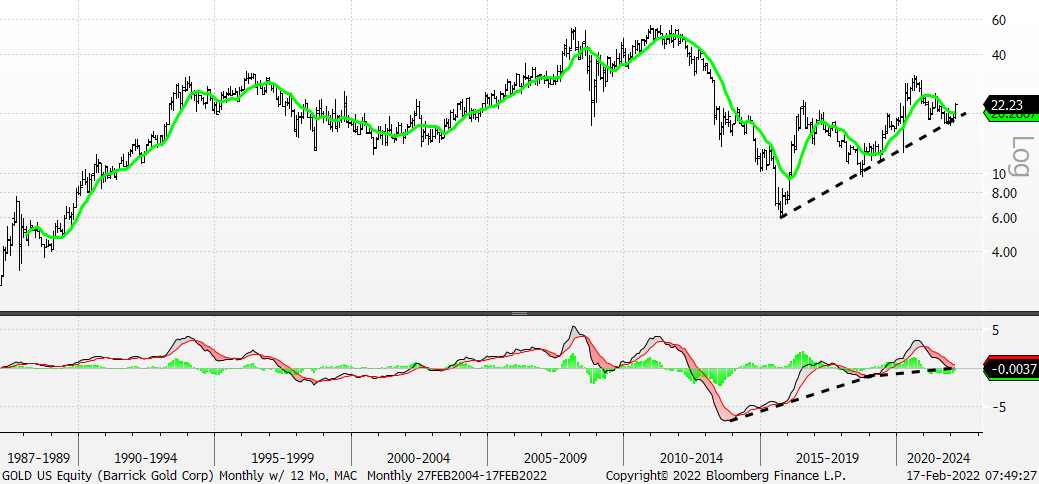
GOLD – Barrick Gold Monthly w/ 12-Month Mov Avg and Monthly MACD
GOLD the stock’s uptrend off the 2015 low is especially clear here and, while it’s not as neat, there is also a series of higher lows in the monthly MACD, too. In addition, and this is also clear, the stock’s 12-month moving average is carving out another higher low of its own. We are looking for GOLD the stock to get to 40.