Source: Google Images
Jim Rogers, investor, author, and former fellow alum of Arnhold and S. Bleichroeder, once said, “The way of the successful investor is normally to do nothing — not until you see money lying there, somewhere over in the corner, and all that is left for you to do is go over and pick it up.”
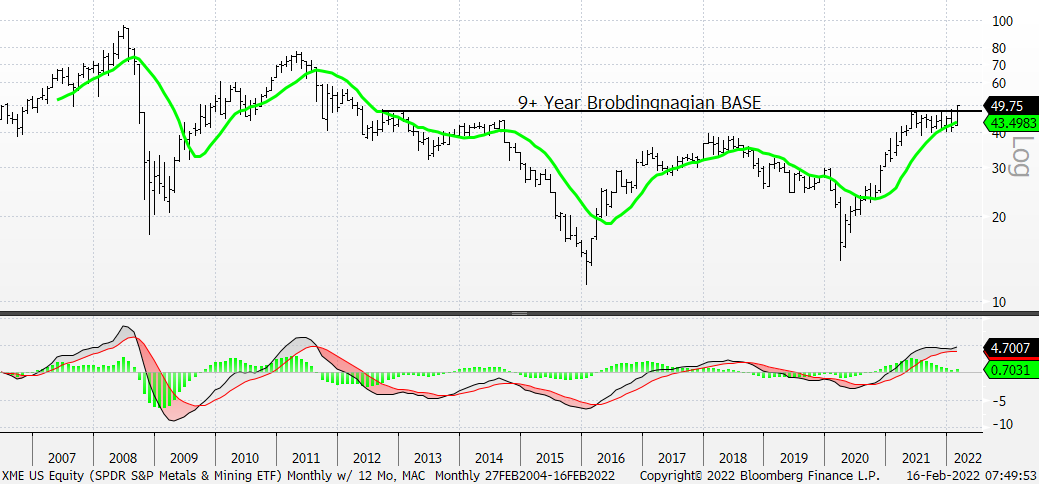
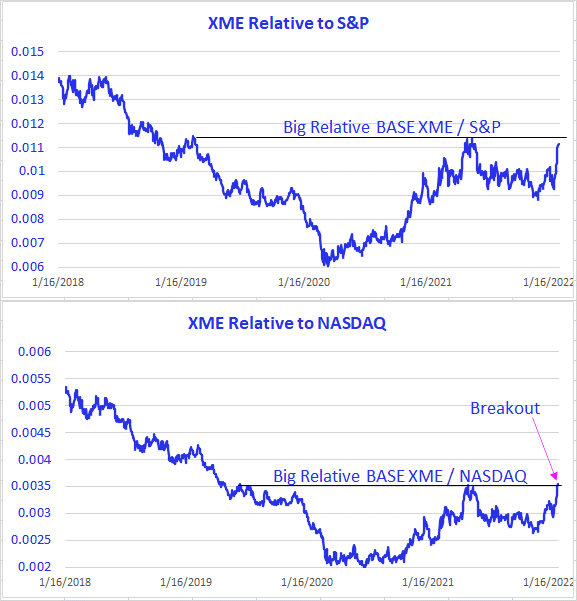
And that’s the way we continue to see commodities, in general, and metals and mining, in particular. For example, amid all of yesterday’s “noise” the SPDR S&P Metals & Mining ETF (XME) gained almost 2%, to extend its recent breakout (monthly chart below), and it is up 24% since an intra-day low of 40 on Jan 28, 2022. In addition, the XME is thisclose to breaking out relative to the S&P 500 (below). Perhaps our imagination is a bit too vivid, but a relative breakout vs. the S&P would likely then bring this group to the attention of currently disbelieving investors. However, for those keeping score at home (remember when Mets’ and Yankees’ announcers used to say that? They said it because some fans actually “kept a scorebook” while watching or listening to games from their couches. Does anyone do this anymore?), the XME has already broken out above its spring 2021 highs vs. NASDAQ (below).
We’ve been pretty consistent in sticking with the theme of being long commodities and commodities related equities and we reviewed this yesterday, along with our guest, the great market polymath Abhijit Chakrabortti, in our 22V Macro Conference.
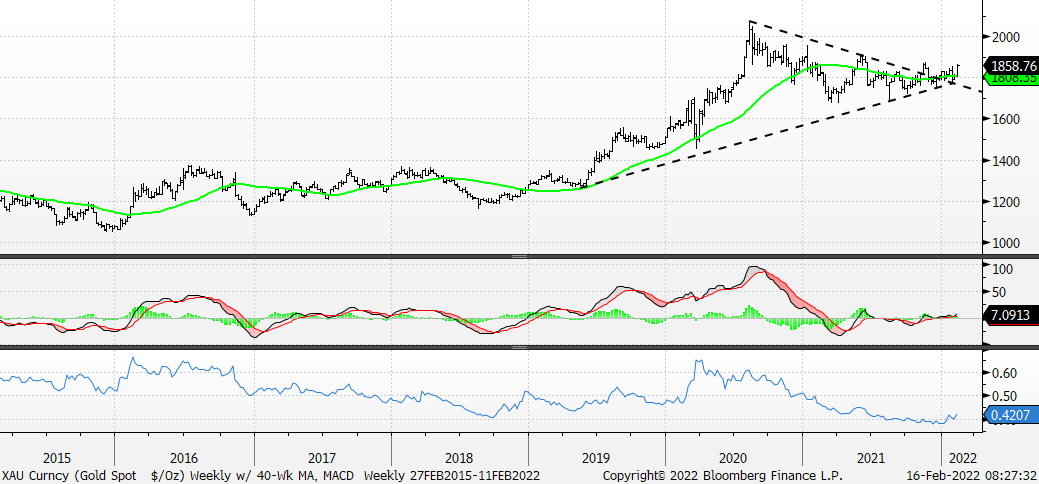
Gold continues to fit Mr. Rogers’ admonition, too. The metal continues to BASE, build, and consolidate as it prepares for what we believe will be a big upside move. We’ve heard all the arguments against gold – and we’re sure you have, too – but we’ll just say that it is hiding in plain sight. The weekly chart below shows gold’s encouraging price action (with its 40-week moving average, top), gold’s weekly MACD with momentum slowly improving within positive territory (middle), and gold improving relative to the S&P (bottom). We continue to believe gold will make a new all-time high.
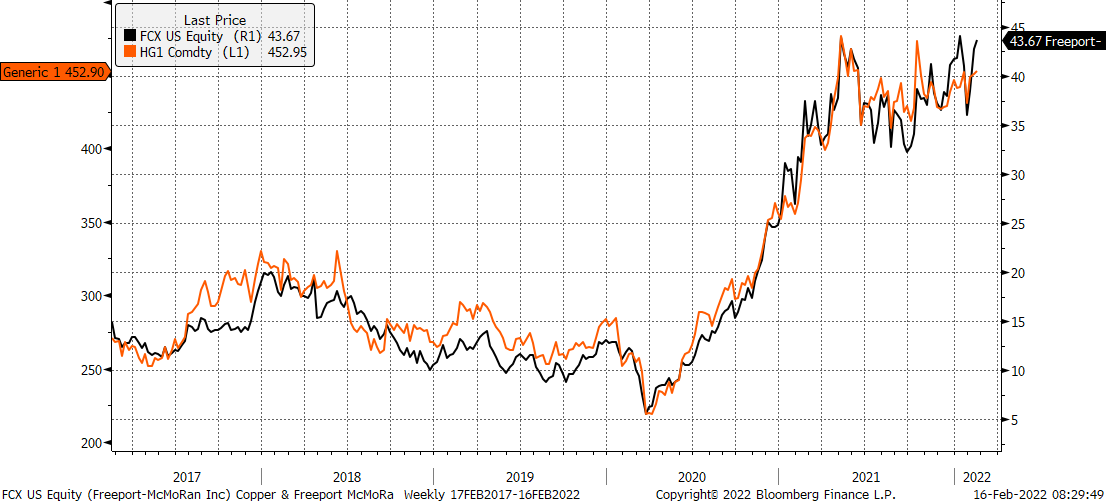
We also continue to like both copper (l) and Freeport-McMoRan (r).