It’s curious to us how John Maynard Keynes and Jesse Livermore had remarkably similar quotes about the exact same subject matter: the expected/obvious and the unexpected. Keynes’ version went like this, “The expected never happens; it is the unexpected always.” And Livermore’s was, “The obvious rarely happens, the unexpected constantly occurs.” It’s not likely that any charges of plagiarism resulted, however. Both men were too busy trading their accounts to notice.
Keynes died in 1883 and Livermore in 1877 (he committed suicide in The Sherry-Netherland Hotel which is still standing at 5th & 59th), both were 63 years old, and while it might be that they were familiar with each other, let’s just say that they shared the same epiphany when they formulated the quotes above.
We still think it’s right to get long gold and, selfishly, it solves for the “unexpected” components for Keynes’ and Livermore’s quotes. Understanding that our biases might be overwhelming our good sense, we still believe that gold is, for most, unacceptable, uncomfortable, uninteresting, unloved, unpleasant, and unwanted. And, as such, a move to a new all-time high for the metal is unexpected. But that’s what we are expecting.
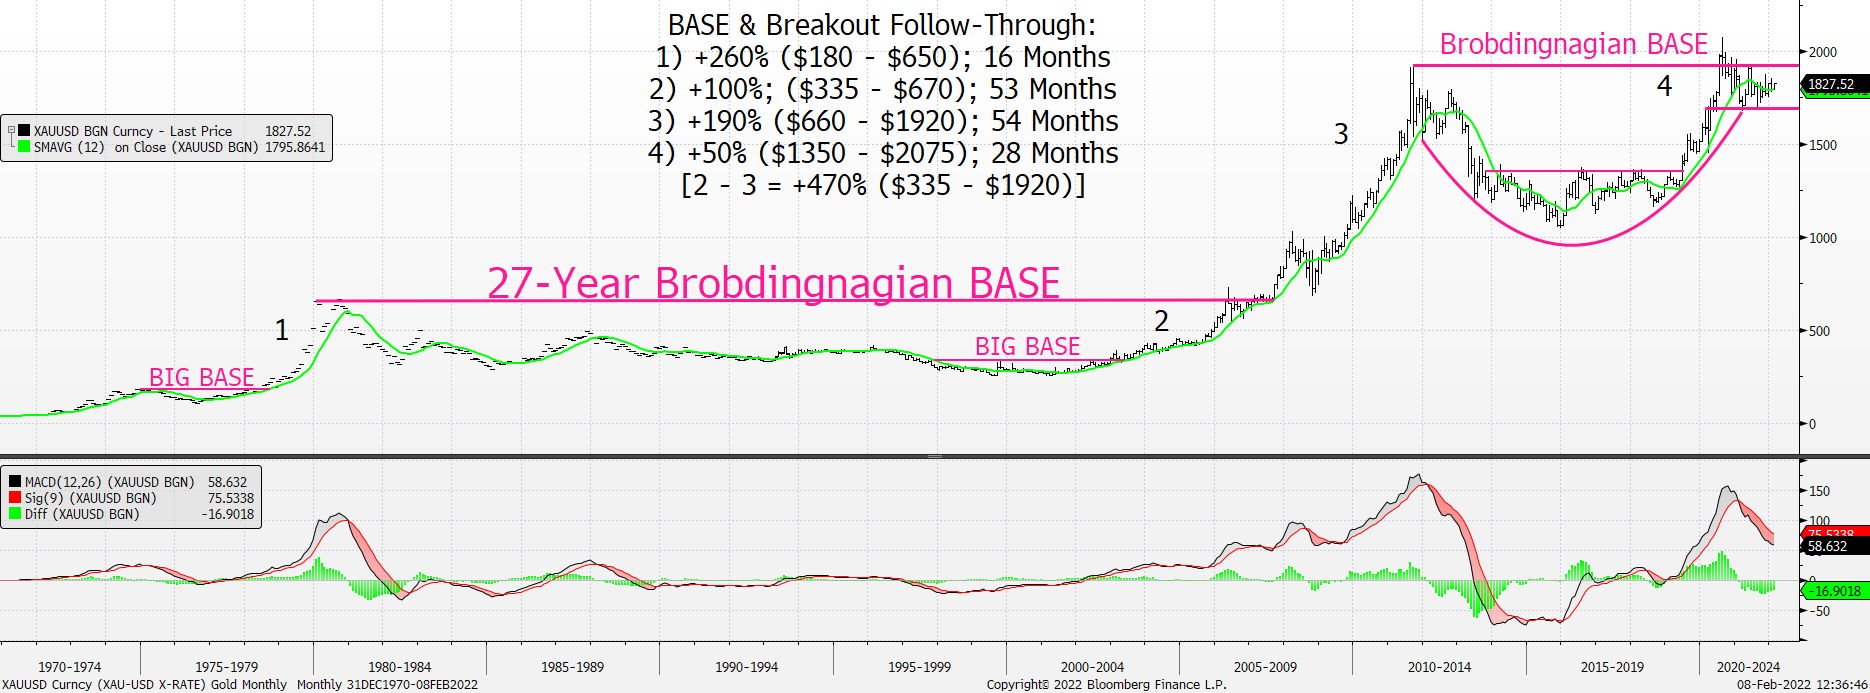
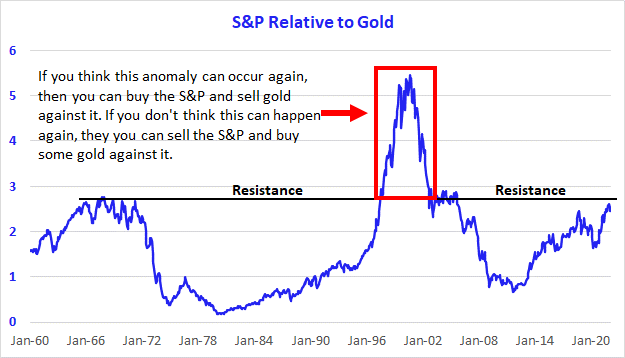
Gold is agonizingly slow to move, but we believe it is building, we believe it is BASING, and – as noted above – we also believe it will make a new all-time high. The chart below shows a relative relationship between the S&P (numerator) and gold (denominator). The data in the chart goes back to 1960 and we’ve drawn the resistance line where we believe it fits appropriately. Plainly, if you think the anomaly of the late 1990s can occur again (red box), then you can buy the S&P here and sell gold against it. However, if you don’t think the late 1990s relationship between the S&P and gold can repeat, then you can sell the S&P here and buy some gold against it. Simple.
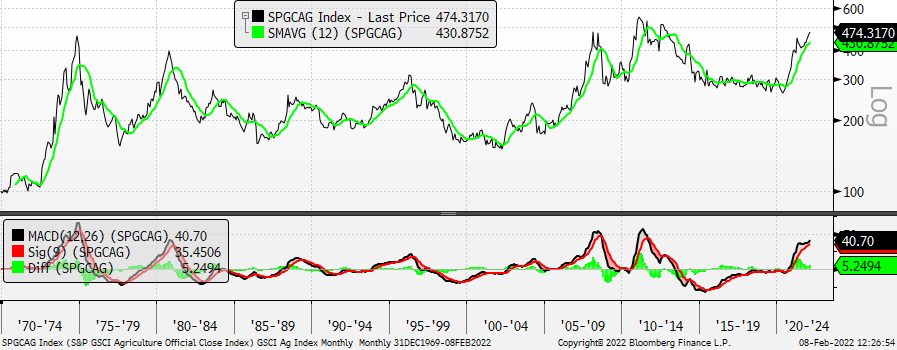
We also continue to like commodities, broadly, and good charts are evident in the Ags, Energy, and Metals markets. And we want to continue to be associated with their equity beneficiaries.
S&P GSCI Agriculture Index – Monthly w/ 12-Month Moving Average and Monthly MACD: Looking for new highs
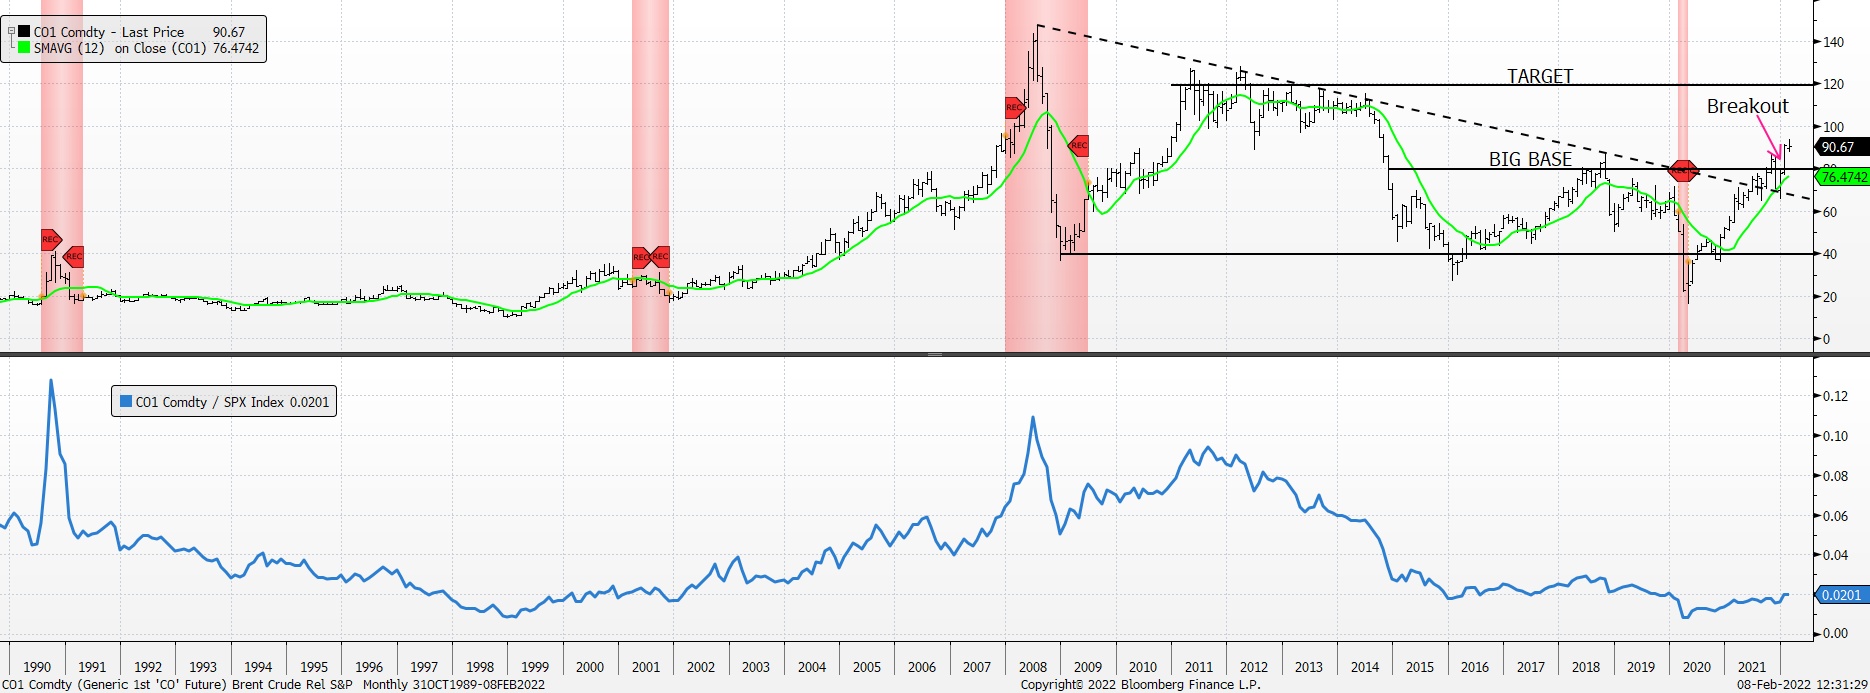
Brent – Monthly w/ 12-Month Moving Average and Monthly MACD: Target $120
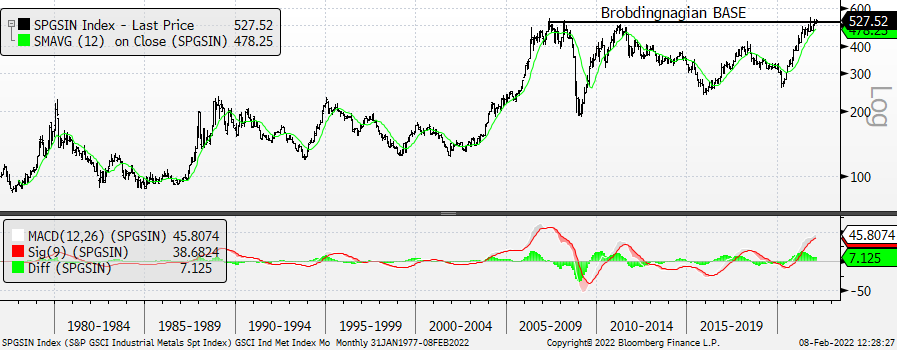
S&P GSCI Industrial Metals Index – Monthly w/ 12-Month Moving Average and Monthly MACD: We continue to expect that the Brobdingnagian BASE will resolve to the upside.
And here’s our long-term chart for gold. BASE & Breakout history has been kind to it.