Look around
Leaves are brown
And the sky is a hazy shade of winter
Look around
Leaves are brown
There’s a patch of snow on the ground
You might remember that The Bangles performed “Hazy Shade of Winter” for the late 80s movie, “Less Than Zero.” The song was originally written by Paul Simon and he and Art Garfunkel released it in 1966. The cover is much better than the original. Here are The Bangles performing it live from a September 2000 show at the House of Blues in Hollywood, CA. Some of the lyrics, at least the ones sampled above, seem so apropos for the current market environment.
So far, the resistance / sell spots we’ve identified for the major indexes have held. While the S&P, NASDAQ, NDX, and DJIA bounced to their levels shown in the table below, the R2000 has not. The bounce for the R2000 has been the weakest in that not only has it not shown any real chutzpah over the last seven trading sessions, but it also hasn’t even been able to get back to what was its breakdown level of 2100.

While not one of these major indexes has worked through their resistance / sell spots, it’s also true that not one of them has made a new reaction low by failing their support levels. At the very least, we believe they will get back there. At worst, we think they break support, and we believe most tech stocks will get back to their post COVID-low spring 2020 break outs a la FB, NFLX, and PYPL.
Ranking these indexes from weakest to firmest (not strongest…not one of them is strong) we come up with the following roster:
The weakest indexes – Russell 2000, NASDAQ, and NDX – have remained below their 200-Day Moving Averages and the firmer indexes – DJIA and S&P – moved slightly above their 200-Day Moving Averages. This might just be a distinction without a real difference because all are weak.
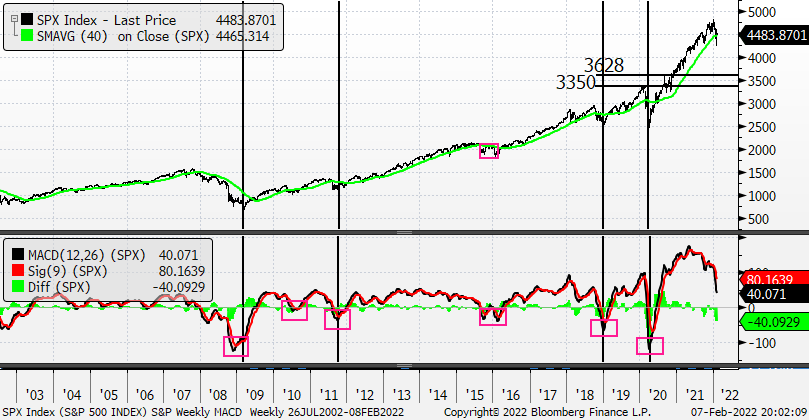
This weekly chart for the S&P shows what potential downside looks like if support for it at 4220 breaks. Please consider that the weekly MACD in the bottom panel is still NOT oversold. In some historical instances, oversold had to get more oversold before a bottom formed.
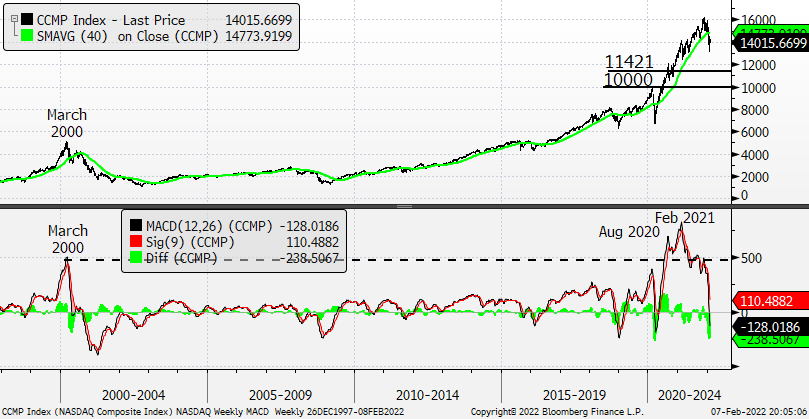
NASDAQ’s weekly chart shows that the index IS oversold. However, the more important take-away is that while NASDAQ is oversold it cannot rally with any breadth or fortitude which emphasizes its poor action. Breaking of support at 13094 will bring into play our downside target levels of 11421 and 10000. The 10000 level would be an entire retracement of the post COVID-low spring 2020 breakout.
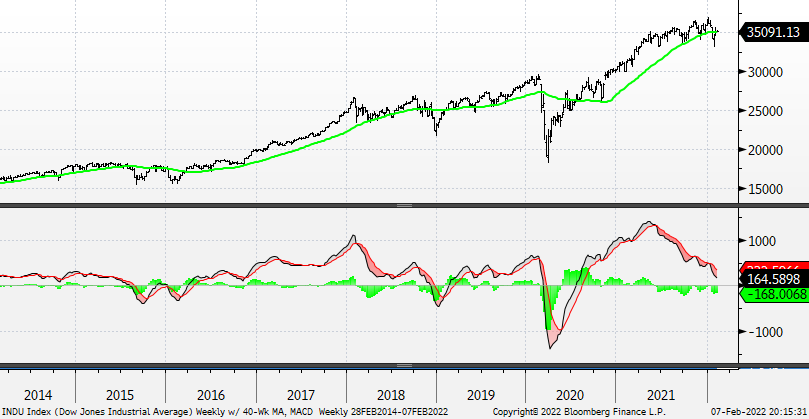
The DJIA is also NOT oversold although its weekly MACD is doing its best to get into negative territory quickly. The DJIA itself had a fake breakout in January 2022 – we hate fake breakouts – that was not confirmed by the weekly MACD, and the index is slowly topping. We want to sell the DJIA here; although that’s true for the S&P, NASDAQ, NDX and R2000, too.
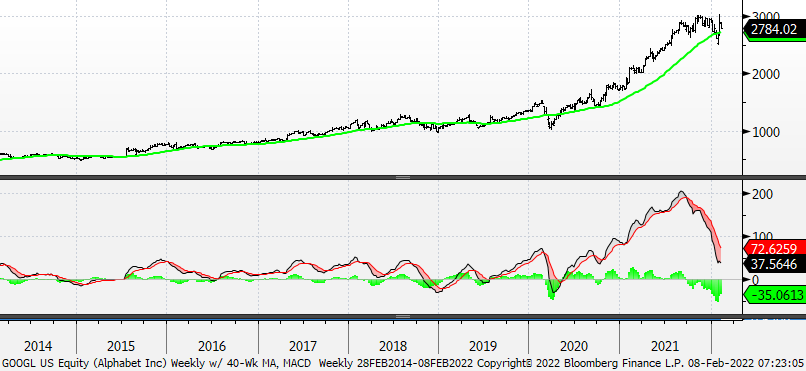
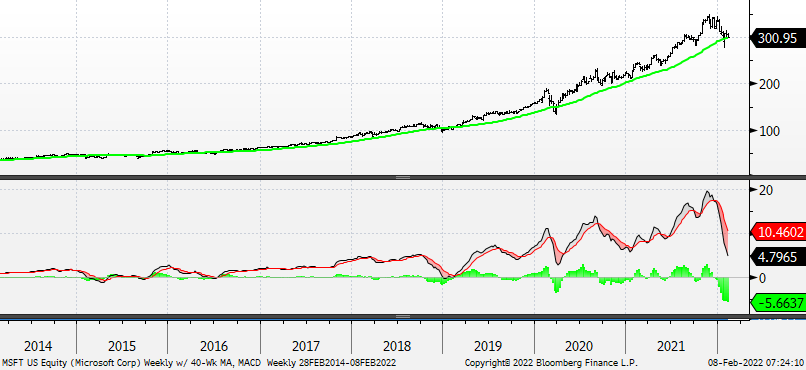
You might think us an apostate for offering up the following, but we continue to believe GOOGL is a reduce / sale at these levels. The stock has not acted well since it gapped up on Feb 2 on earnings. And, to confirm our blaspheming we think it’s a good idea to reduce / sell MSFT on any bounce. It would not surprise us to see the stock at 250.
GOOGL – Weekly w/ 40-Week Mov Avg and Weekly MACD: Our downside target for GOOGL remains @ 2000
MSFT – Weekly w/ 40-Week Mov Avg and Weekly MACD: Our downside target for MSFT is @ 250
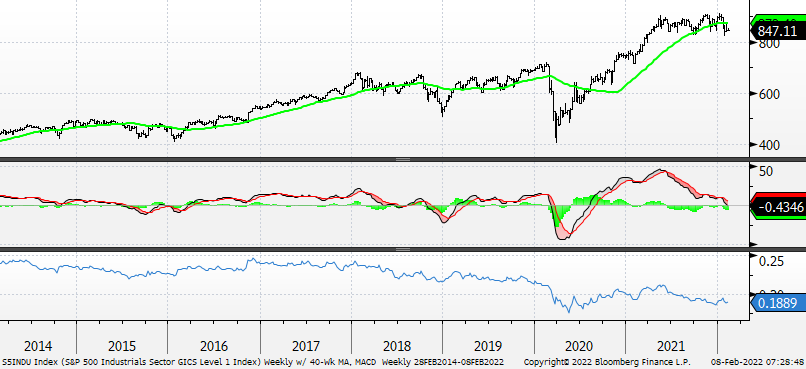
We’re trying to stay consistent with our yield commentary (higher) and with our market commentary (lower), too. Market weakness is now infecting the Industrials Sector as its Technical Score has weakened to 1 with 67% of the stocks in the Sector having weak to bearish scores. The S&P Industrials (top panel) is now below its cresting 40-Week Moving Average, its weekly MACD (middle panel) is thisclose to negative territory, and relative to the S&P 500 (bottom panel) it is close to testing its 2020 lows.
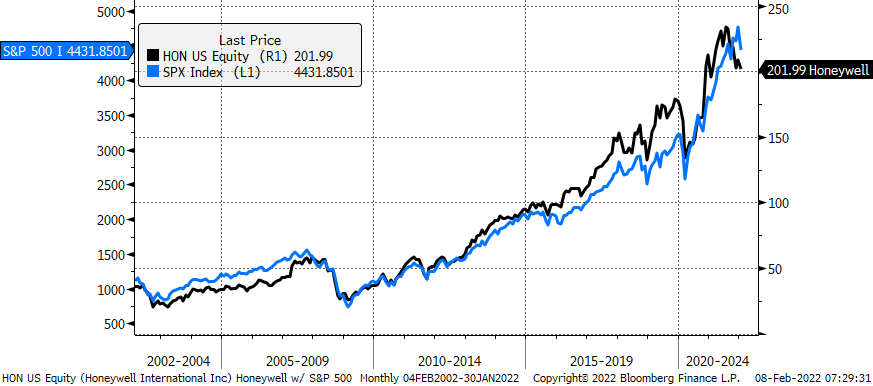
Most troubling to us is that Honeywell’s deterioration is likely a precursor for more weakness in the S&P 500. In a prior era when the S&P was more of an economic indicator, and less of a tech index, we often used Honeywell (HON) as a bellwether for the S&P. We still find HON to be helpful and right here it is weaker than the S&P and is below its downward-sloping 50, 100, and 200-day moving averages. Key near-term support for HON was at 200 and it broke beneath that level last week in a damaging way. Its monthly chart below, along with that for the S&P, looks like an important top.
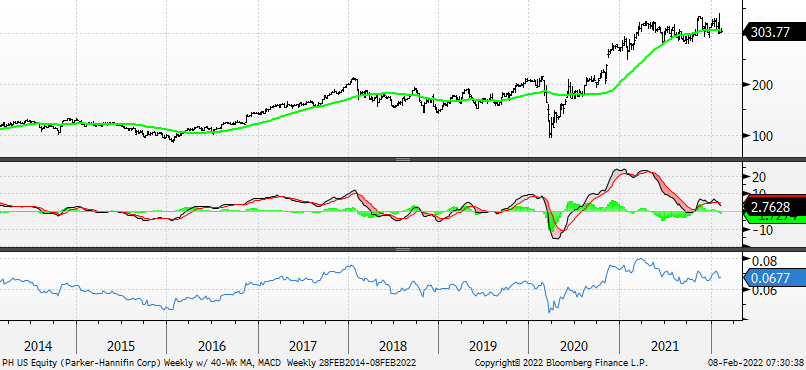
The chart here is for Parker-Hannifin and its Technical Score is 2 (Neutral). However, we noticed that it didn’t trade well last Thursday as it gapped up at the open – touched its intra-day high of 340 on good fundamental news – and then proceeded to decline throughout the day to close at 311.56 for an intra-day move lower of 8.4%. Fake breakouts – and this was an intra-day fake breakout failure – always make us nervous and this one is no exception. We think PH is worth shorting here with a target of 250.
Switching gears, a bit, we still think it’s right to get long gold. It is agonizingly slow to move, but we believe it is building and we also believe it will make a new all-time high. The chart below shows a relative relationship between the S&P (numerator) and gold (denominator). The data in the chart goes back to 1960 and we’ve drawn the resistance line where we believe it is most appropriate. In short, if you think the anomaly of the late 1990s can occur again, then you can buy the S&P and sell gold against it. If you don’t think it can happen again, they you can sell the S&P and buy some gold against it. Seems pretty cut and dried to us.
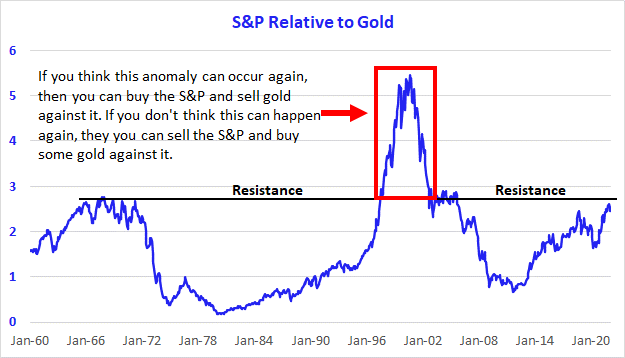
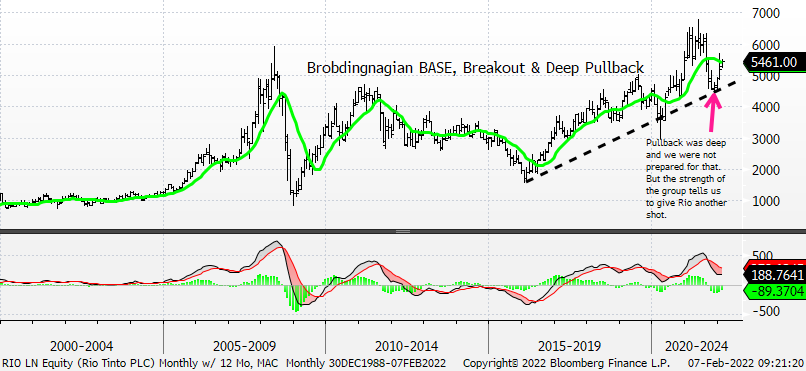
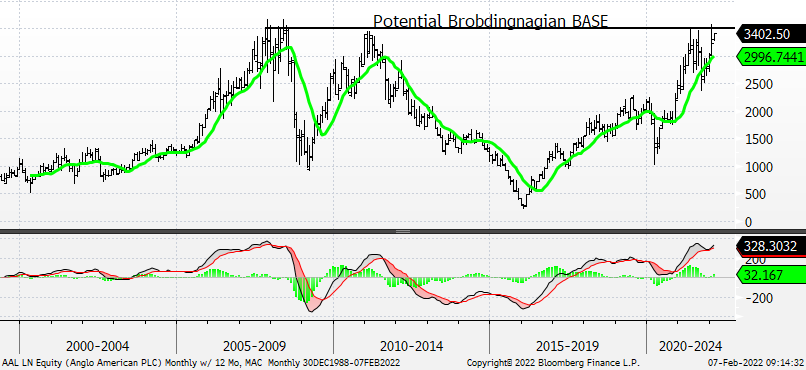
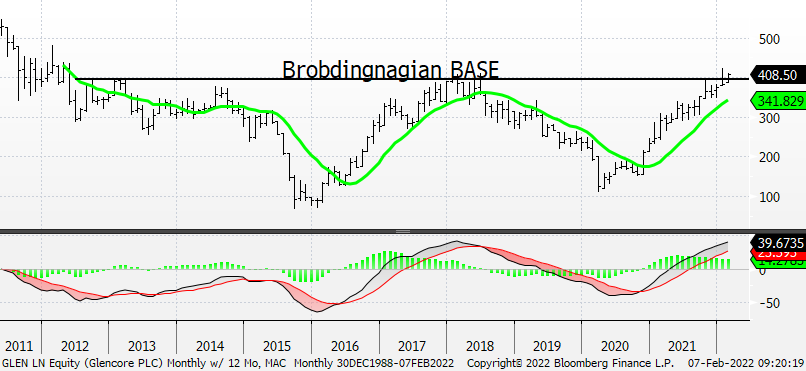
Chart Spotlight – Iron Ore Stocks – Brobdingnagian BASES
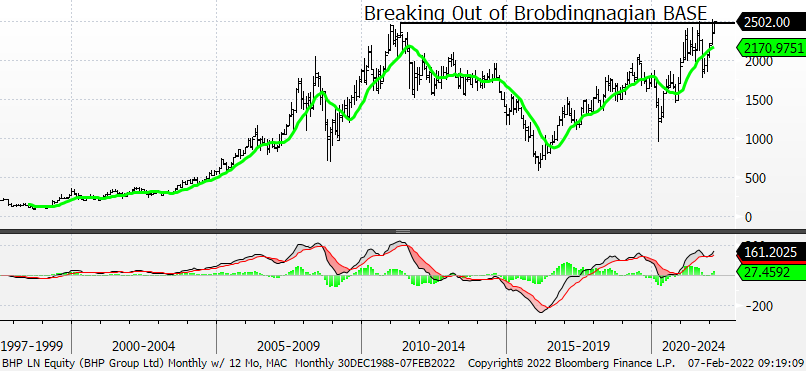
Iron Ore futures continue to rally today on news out of China. You’ll see quickly why we like the setups here. Brobdingnagian BASES speak for themselves. All these stocks are buys.
Anglo American (AAL LN, Technical Score = 4)
BHP Group (BHP LN, Technical Score = 4)
Glencore (GLEN LN, Technical Score = 4)
Rio Tinto (RIO LN, Technical Score = 3)