We always think of two things when we hear the phrase “old school.” The first is a quote from Michael Crichton that goes like this, ““If you don’t know history, then you don’t know anything. You are a leaf that doesn’t know it is part of a tree.” The second is a classic scene from the early ‘90s movie “Doc Hollywood” which starred Michael J. Fox. In the scene, Fox as Dr. Stone (“Doc Hollywood”) is schooled by Dr. Hogue who teaches the brash, young, and hubristic “Hollywood” that it’s important to know the difference between crap and Crisco.
The market is always right, but it strikes us as odd that low inflation was bullish and 40-year highs in inflation is bullish, too. Similarly, exceptionally low interest rates were bullish and now rising interest rates are bullish. Low commodity prices were bullish because input prices were low and now high commodity prices are bullish, and not only for commodity producers. A strong President projects assurance, confidence, and spirit and now a weakened and weak President (or Prime Minister, as the case may be) is bullish. You understand our point.
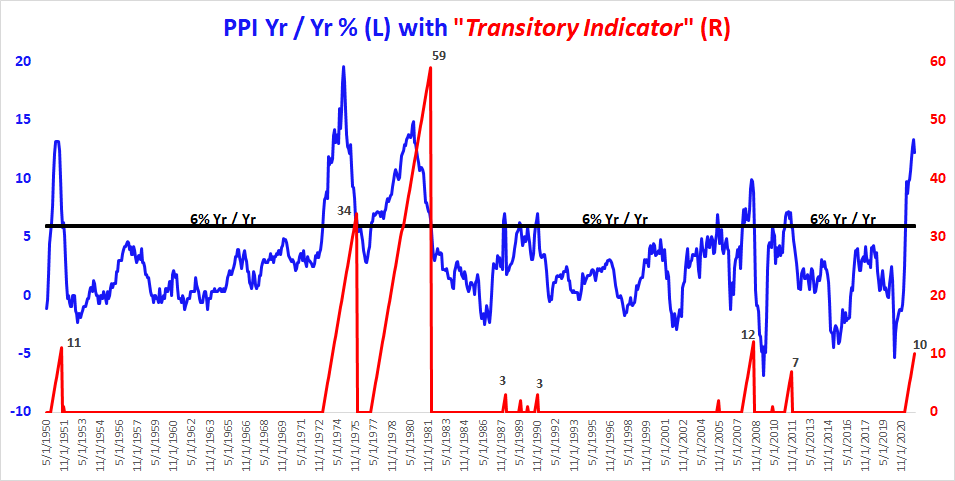
The chart below shows the PPI Yr / Yr% (L) with our “Transitory Indicator” (R). We gave the indicator its name because (a) we didn’t believe Jay Powell for one second when he first offered his lame inflation excuse and (b) it’s always humorous to us how Wall Street embraces these types of mantras. Remember “shovel ready?”
All we’ve done here via the red line is count the number of consecutive months that the PPI has, over time, been above 6%. The current streak is 10 months long and is the fifth longest streak of “transitory inflation” in 72 years. An “old school” review of each of the four longer streaks revealed that in 3 of 4 of them the S&P had, to put it mildly, troubles. The only time “transitory inflation” has transitioned this long, and the S&P did not suffer was from Oct 1950 – Aug 1951. Otherwise, the S&P dropped 48% during the 34-month “transitory inflation” period from Mar 1973 – Dec 1975, it fell 13%% then gained 61% before declining 14% during the 59-month “transitory inflation” period from Mar 1977 – Jan 1982, and a 28%% decline during the “transitory inflation” stretch from Oct 2007 – Sept 2008.
Like we noted above, the market is always right, and we could be in another Oct 1950 – Aug 1951 time frame where we are battling high inflation and the S&P goes along unscathed. If that happens then we want to continue to be associated with Non-Growth (Energy, Financials, Industrials, and Materials) with a big concentration in commodity related equities. Besides, we also think it’s a good idea to understand a bit of the market’s history because you never know when things can sneak up on you if you’re not paying attention.