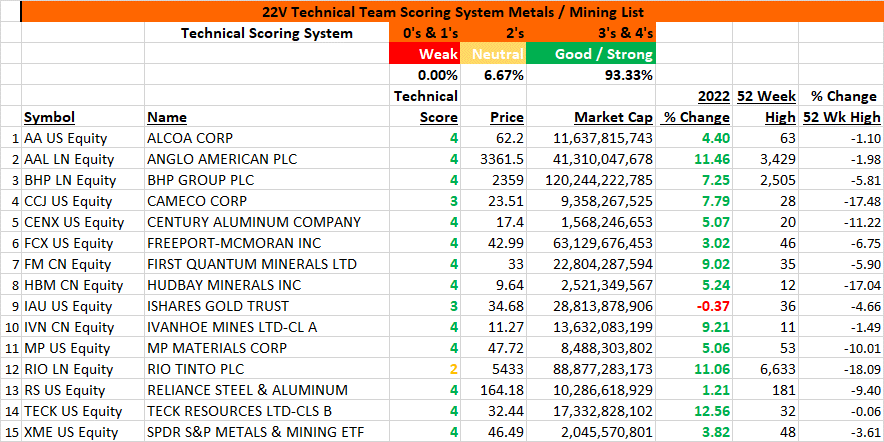
The following list of metals / mining stocks includes two ETFs (IAU and XME), and the overall scoring is encouraging with 93% of the components sporting Good / Strong Technical Scores. Moreover, there are no Weak Scores. Please check below for the charts for these items. The message here is consistent with our theme of focusing on commodity related equities because if we’re not focusing on them in a commodity bull market, when would we?
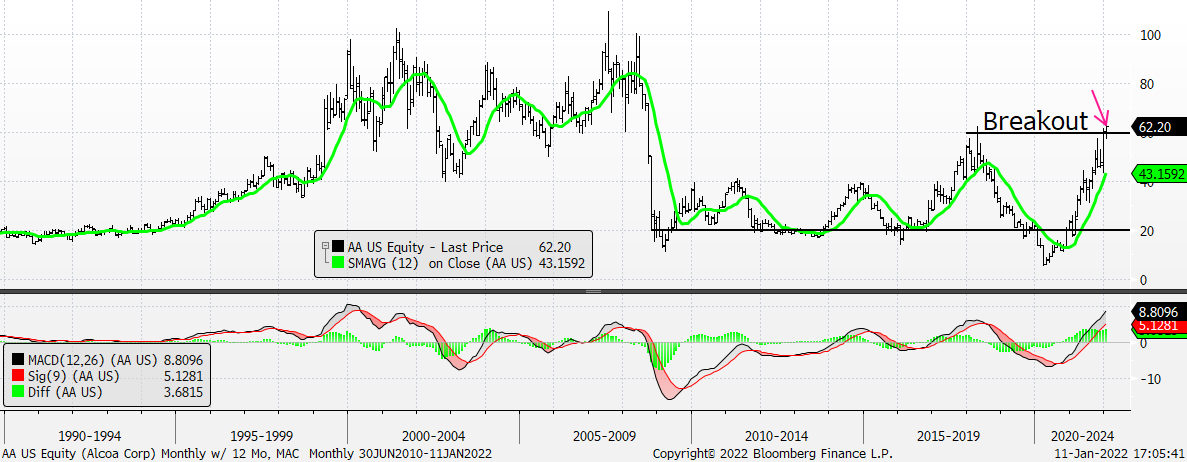
Alcoa – Monthly w/ 12-Month Mov Avg and Monthly MACD: Up more than 1100% since its March 2020 low which is better than any stock in the NASDAQ 100 over the same period. We’d like to do some buying on any consolidation – like the one that occurred from mid-Oct ’21 – now.
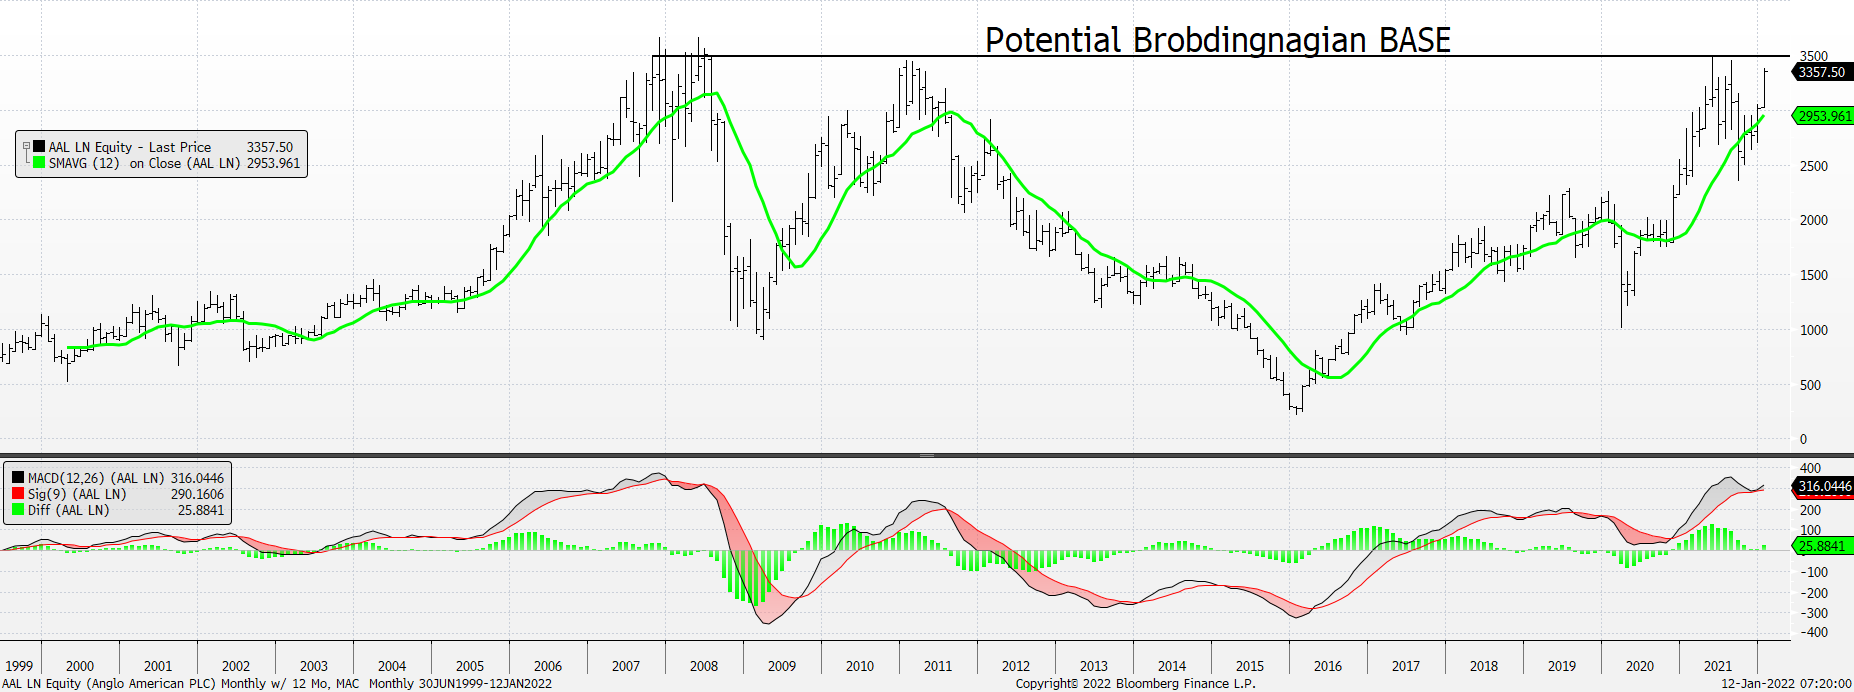
Anglo American – Monthly w/ 12-Month Mov Avg and Monthly MACD: One of four Iron Ore stocks on our list and, as you can well expect, we’re beguiled but the potential prospects of its Brobdingnagian BASE.
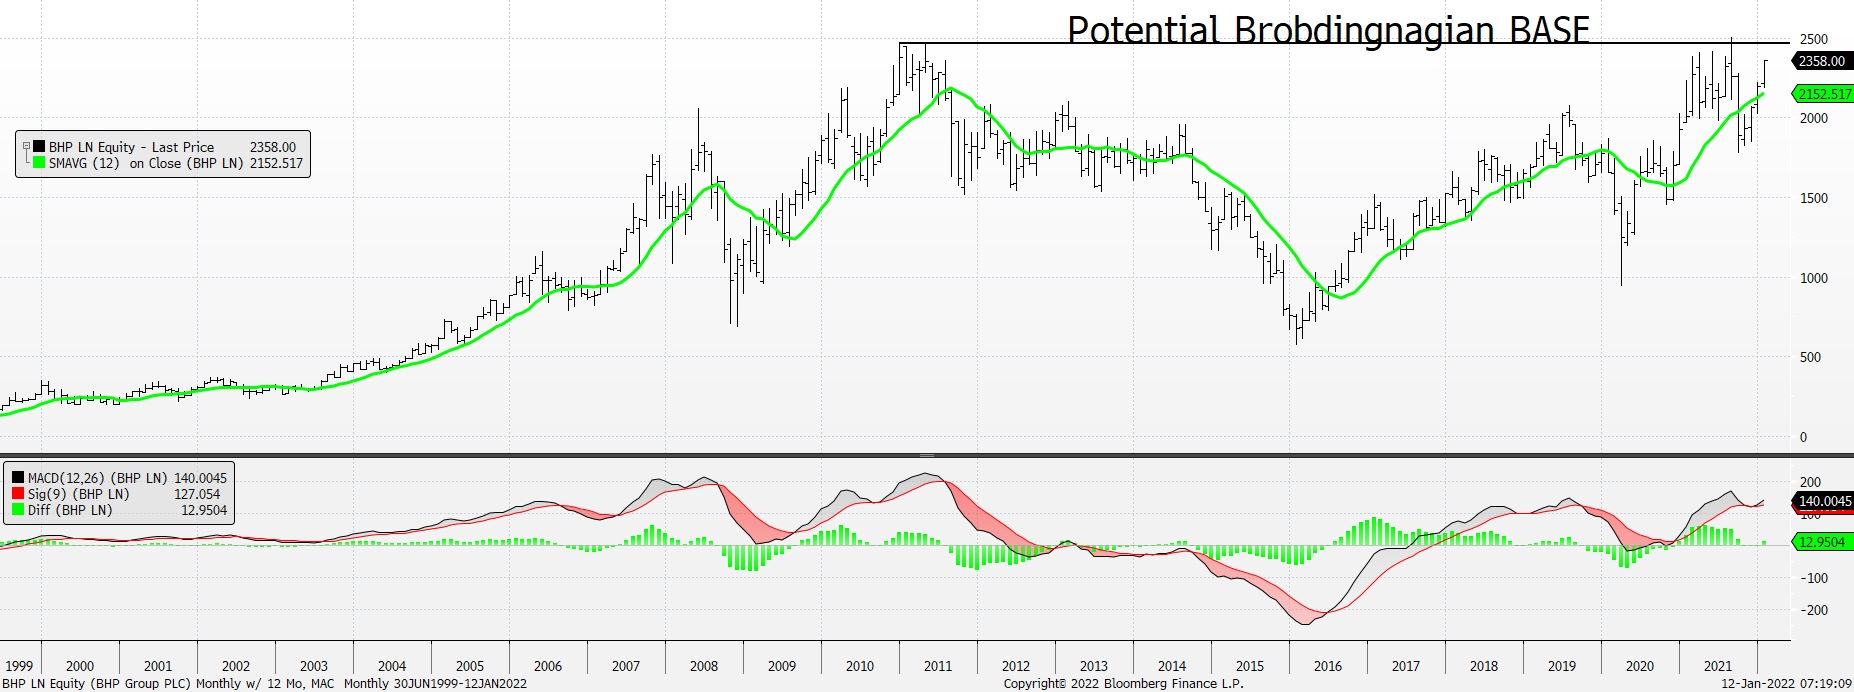
BHP Group – Monthly w/ 12-Month Mov Avg and Monthly MACD: Ditto
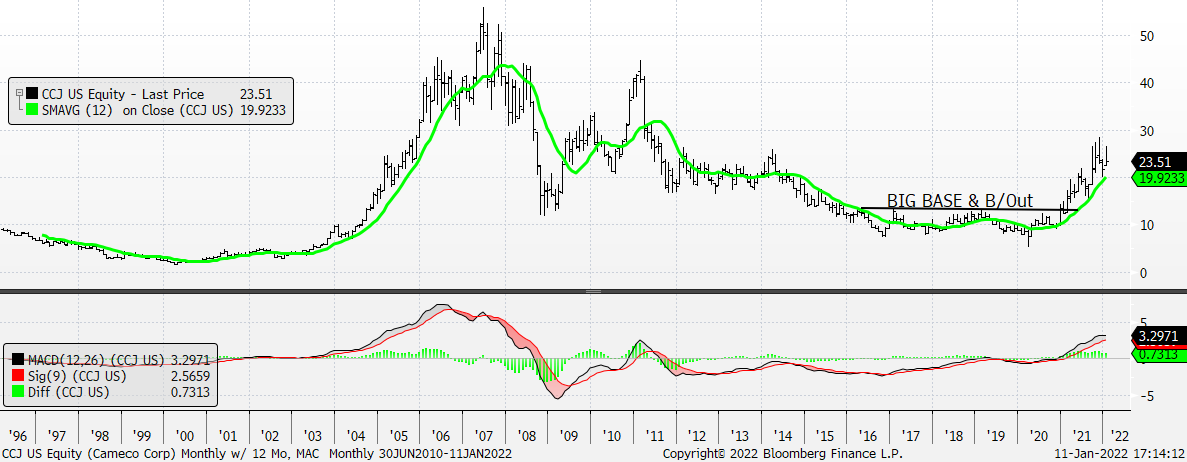
Cameco – Monthly w/ 12-Month Mov Avg and Monthly MACD: Was a BIG BASE & Breakout in early Dec ’20 and might need to consolidate again before its next push higher; but we think its right to do some buying here. The current BASE is about 4-months long.
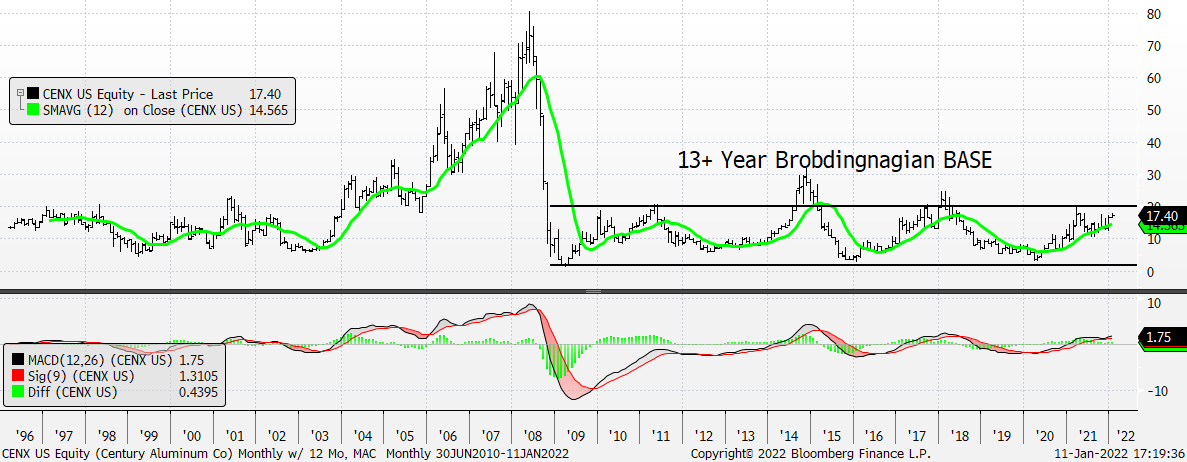
Century Aluminum – Monthly w/ 12-Month Mov Avg and Monthly MACD: Alcoa, shown above, has performed better than CENX off the March 2020 low we want to be aggressive with this one here and the daily set-up is attractive, too.
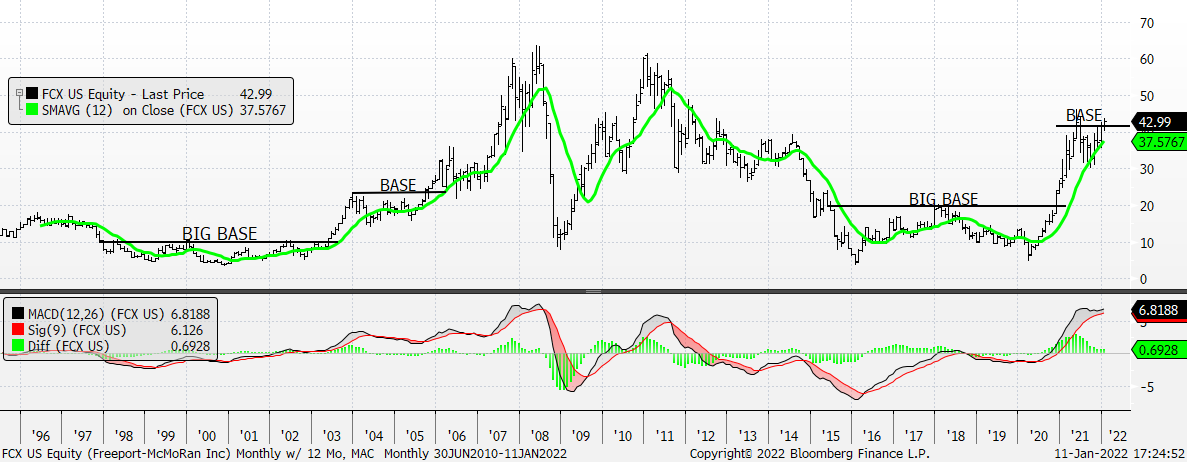
Freeport-McMoRan – Monthly w/ 12-Month Mov Avg and Monthly MACD: We’ve highlighted this one a lot and believe a $60 figure is doable.
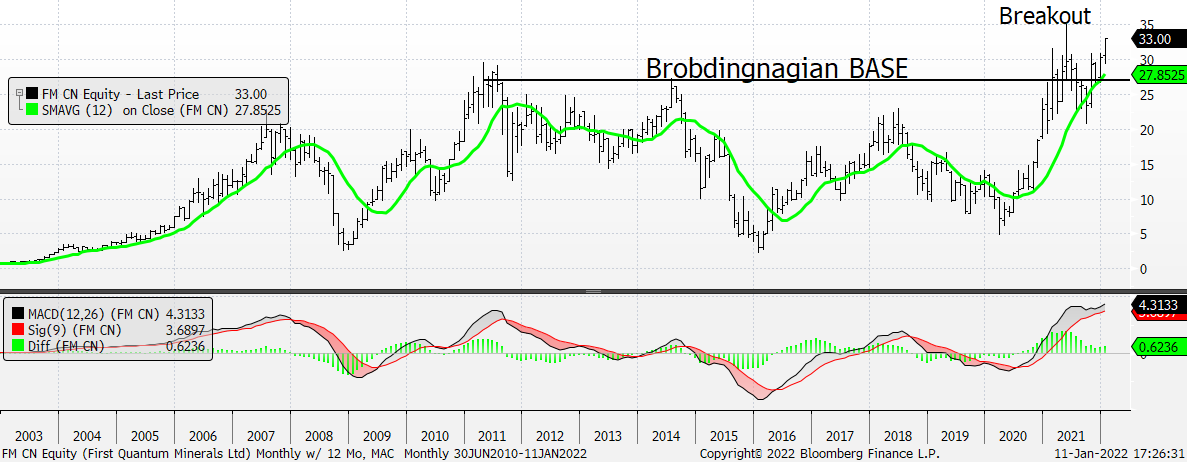
First Quantum Minerals – Monthly w/ 12-Month Mov Avg and Monthly MACD: Brobdingnagian BASE & Breakout. If we’re not buying this, we’re not buying anything.
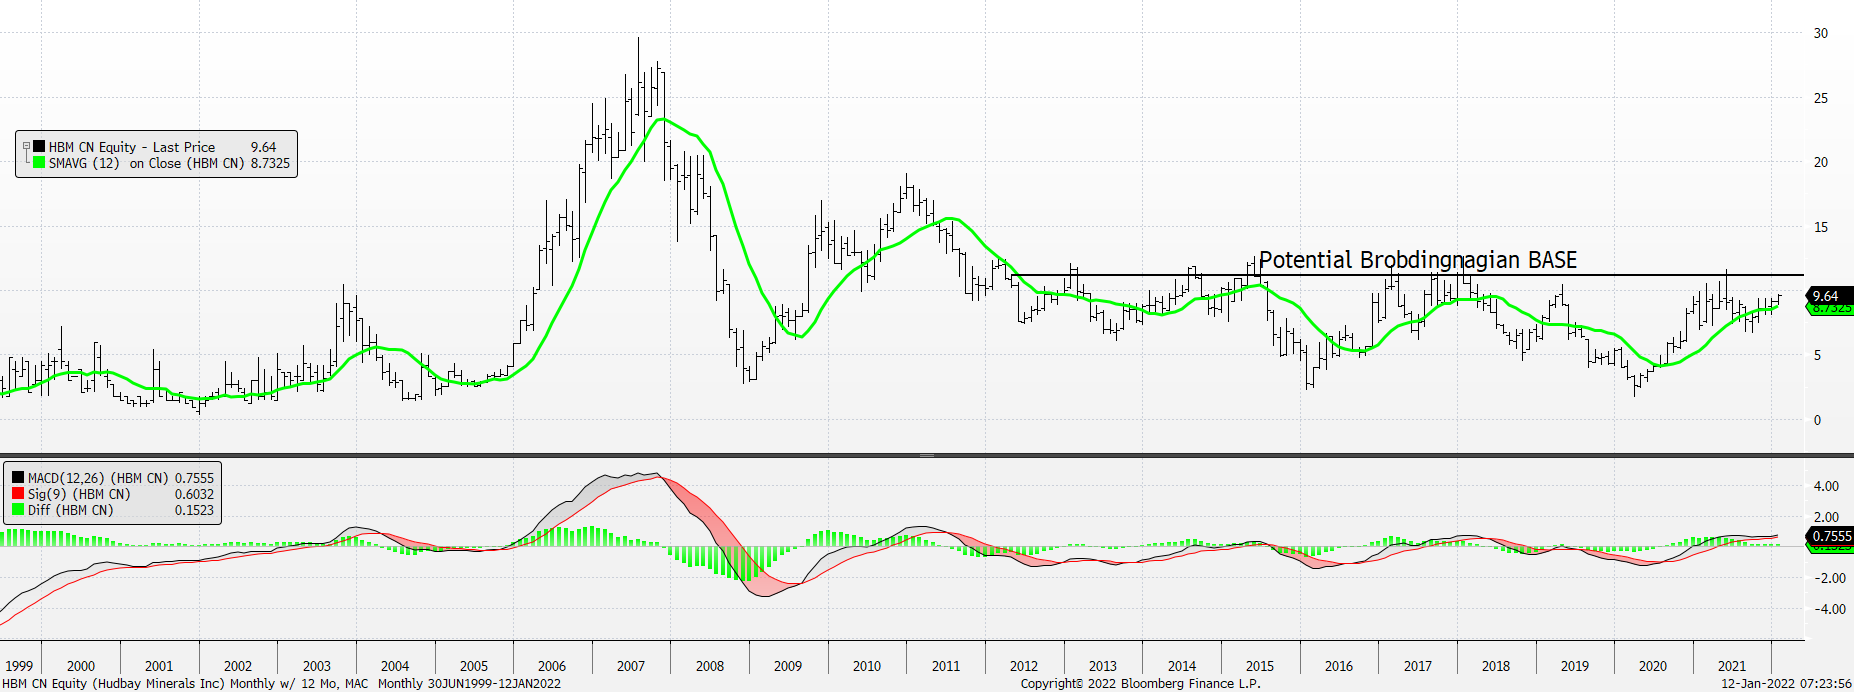
Hudbay Minerals – Monthly w/ 12-Month Mov Avg and Monthly MACD. Potential Brobdingnagian BASE.
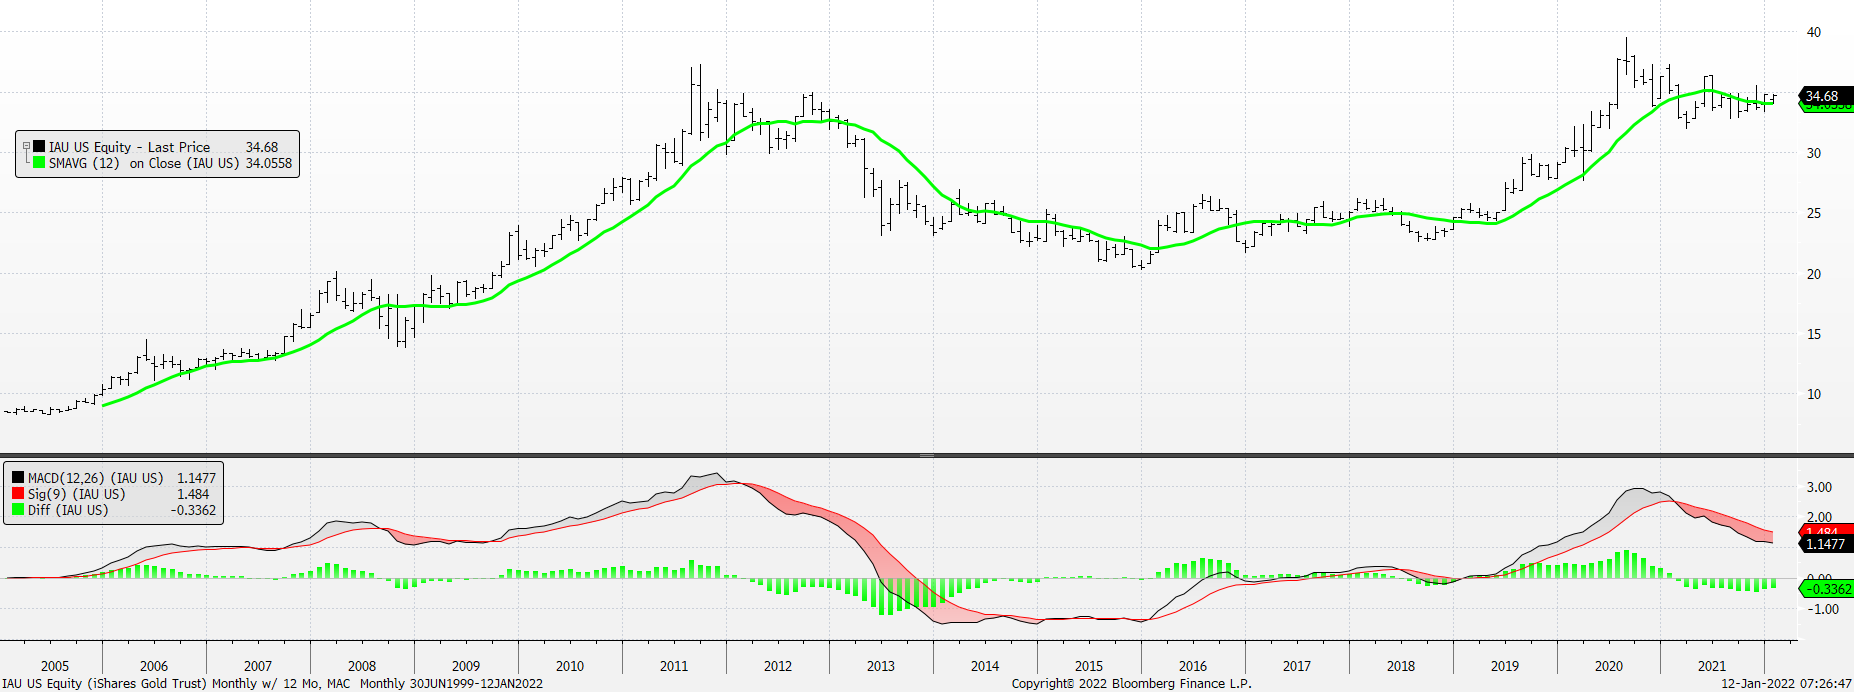
iShares Gold Trust ETF – Monthly w/ 12-Month Mov Avg and Monthly MACD: We believe gold is building to an important upside move. The IAU offers an effective way to get involved. The IAU, like gold, is “in the pocket.”
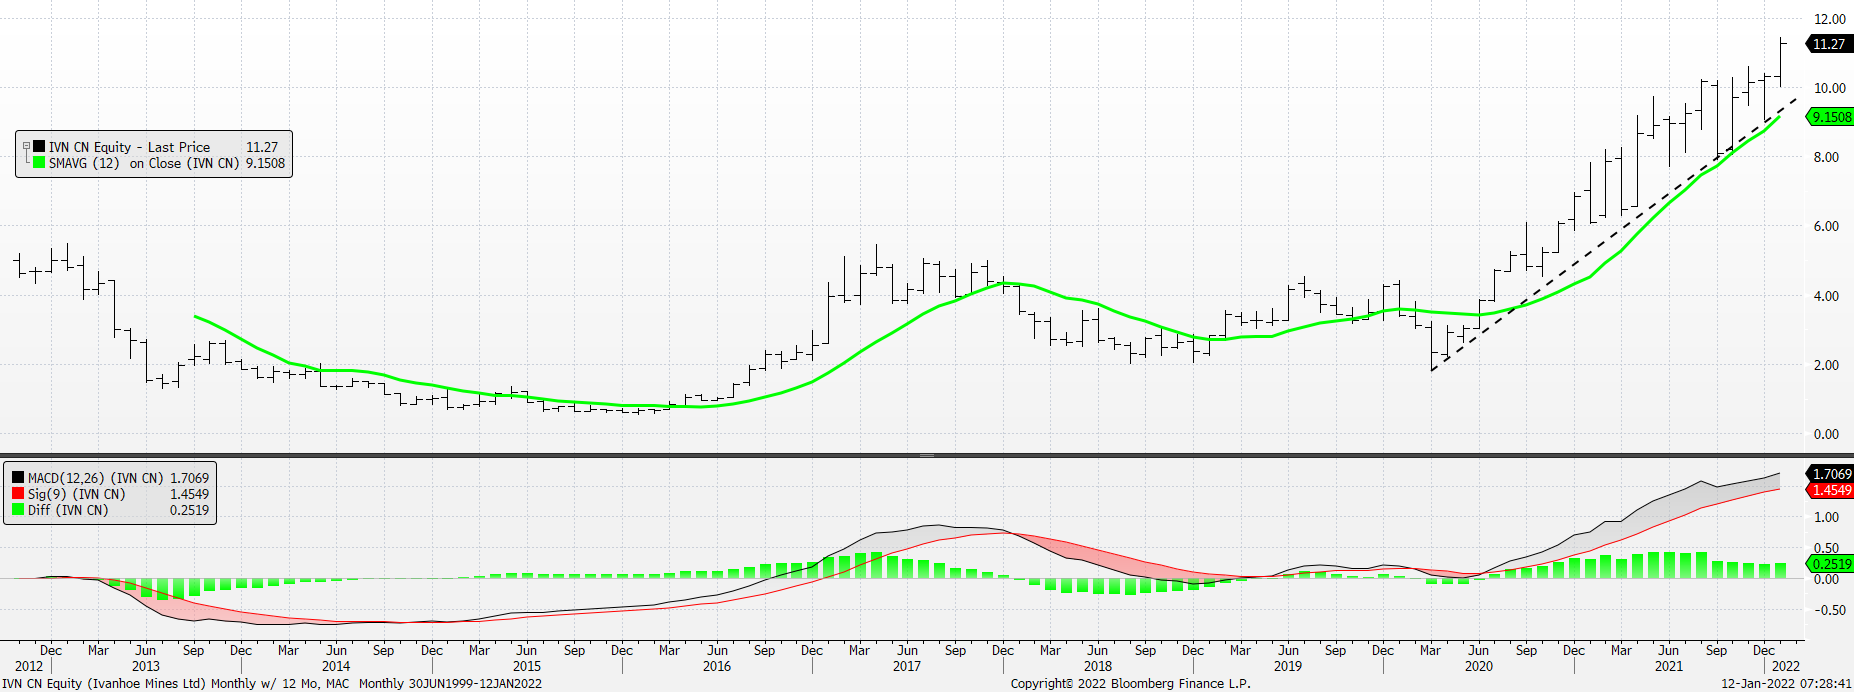
Ivanhoe Mines – Monthly w/ 12-Month Mov Avg and Monthly MACD: Steady uptrend with an impulsive breakout.
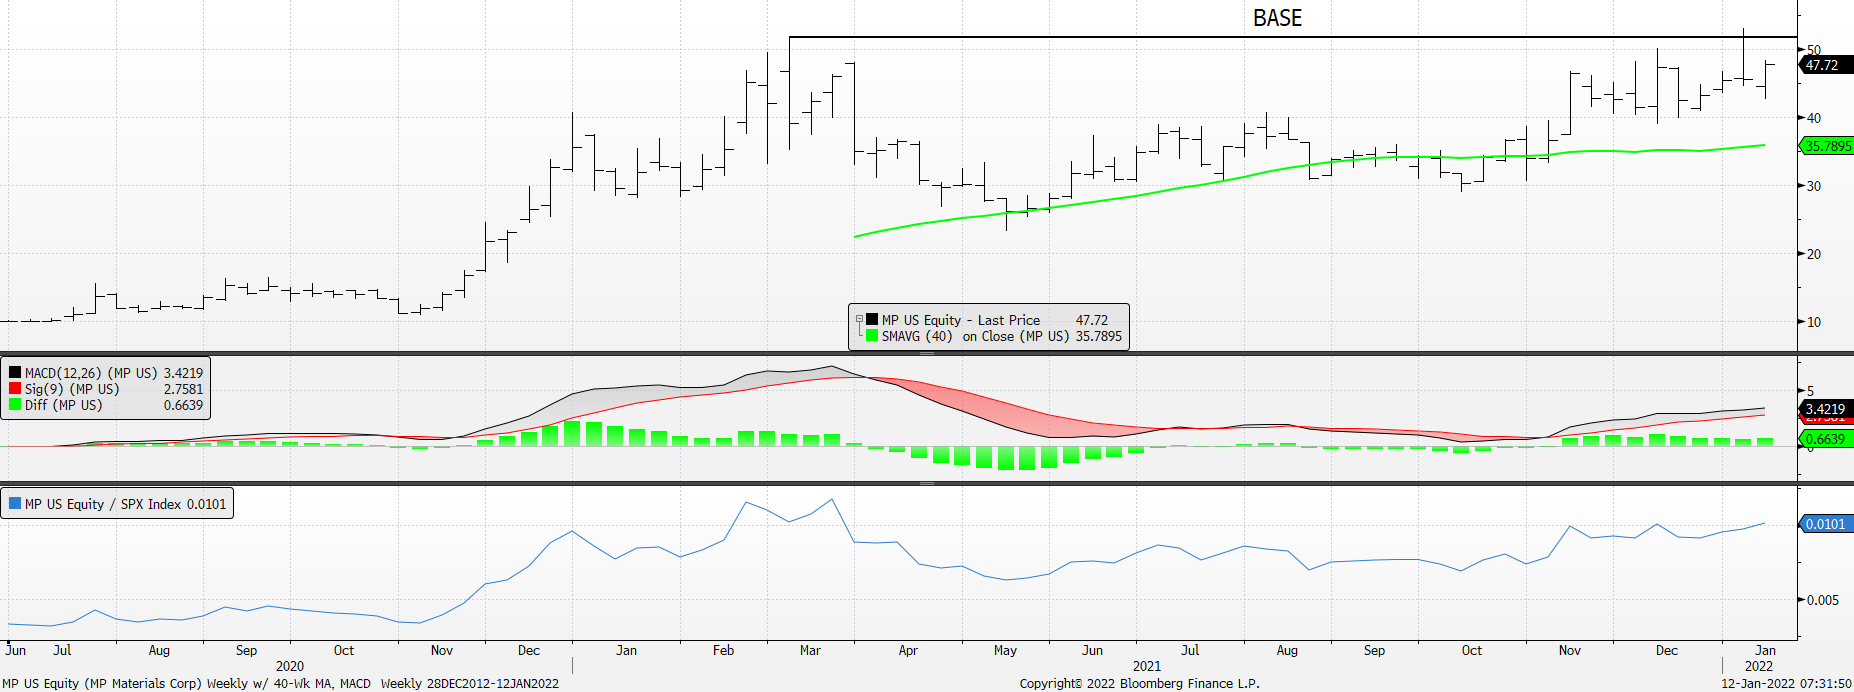
MP Materials – Weekly w/ 40-Week Mov Avg, Weekly MACD, and Rel. to S&P 500: BASE
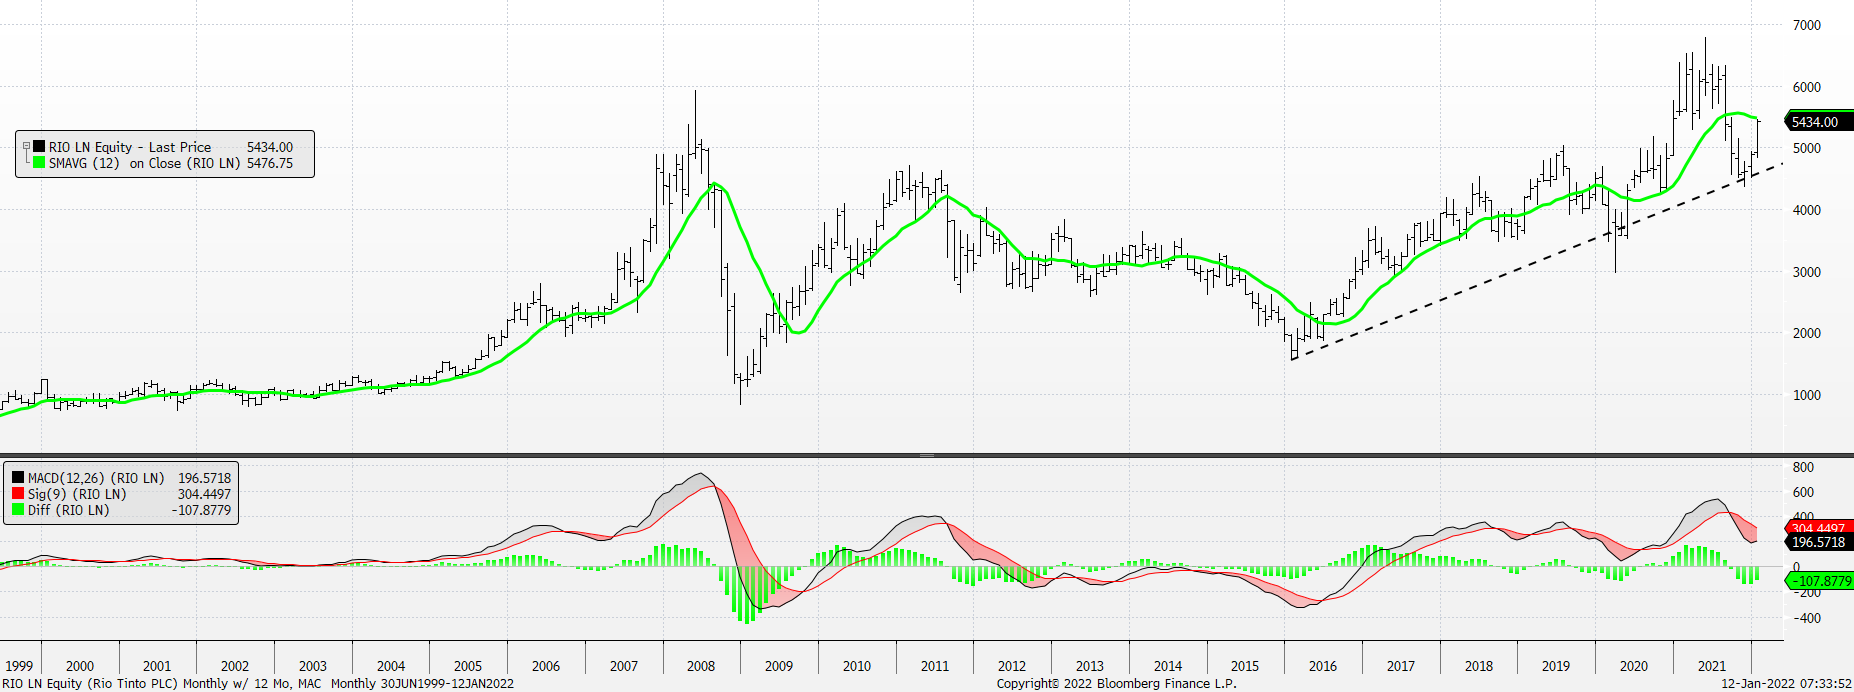
Rio Tinto – Monthly w/ 12-Month Mov Avg and Monthly MACD: The set up into December 2020 was pluperfect and the stock rallied about 35% into its May 2021 peak. Then it pulled back / corrected more deeply than we anticipated. But we like that it has repaired itself nicely – along with the other iron ore stocks in this packet. Too, the higher lows / uptrend since the 2016 bottom is still in force.
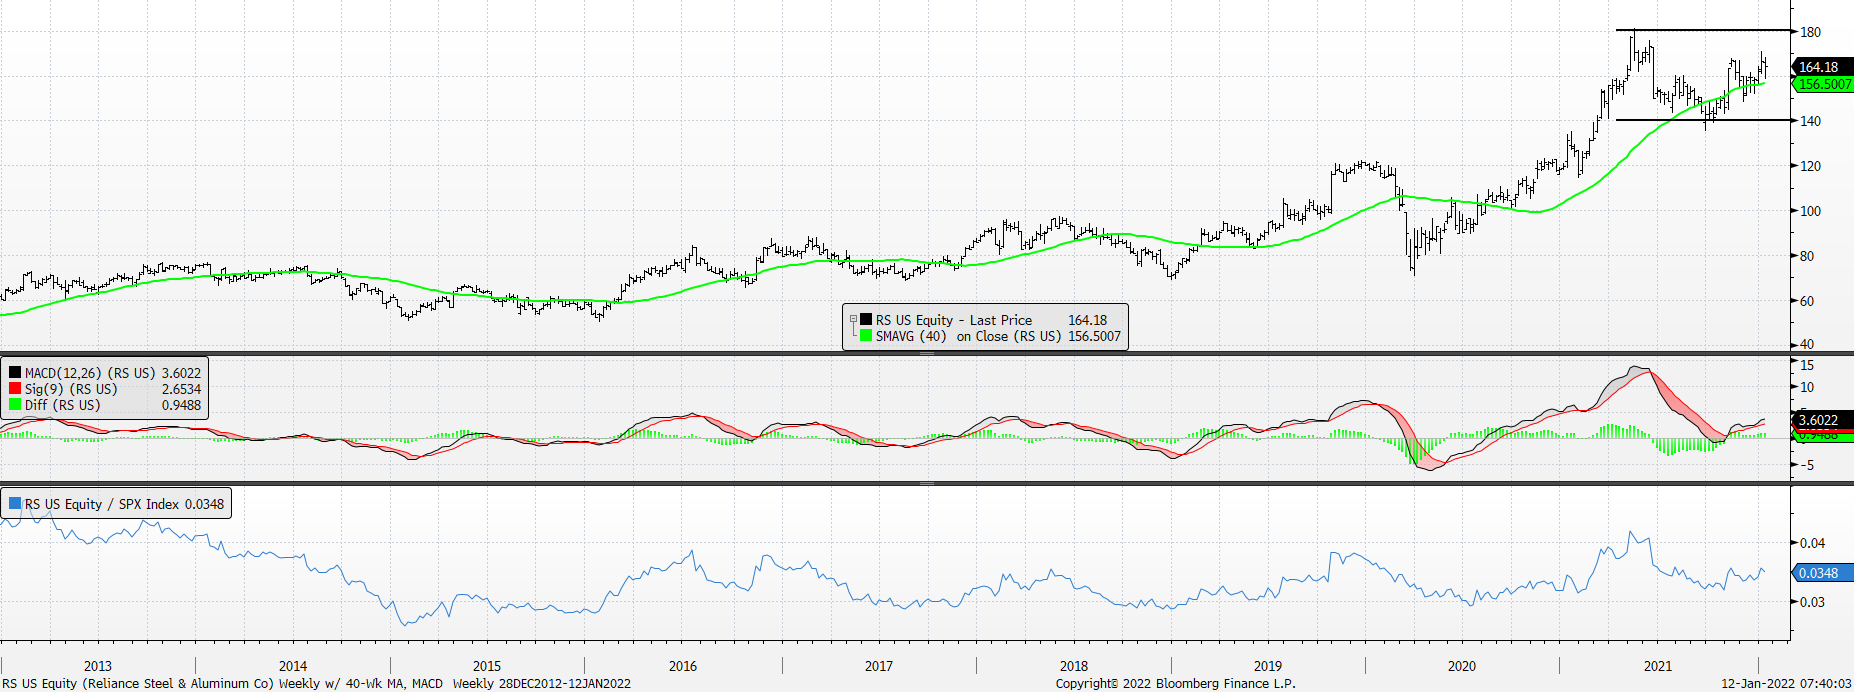
Reliance Steel & Aluminum – Weekly w/ 40-Week Mov Avg, Weekly MACD, and Rel. to S&P 500: Still consolidating after its big run from Mar ’20 – May ’21. But it’s in a well-defined uptrend and its weekly MACD has turned up. It’s not special on a relative basis vs. the S&P, but we don’t think that’s a tremendous negative.
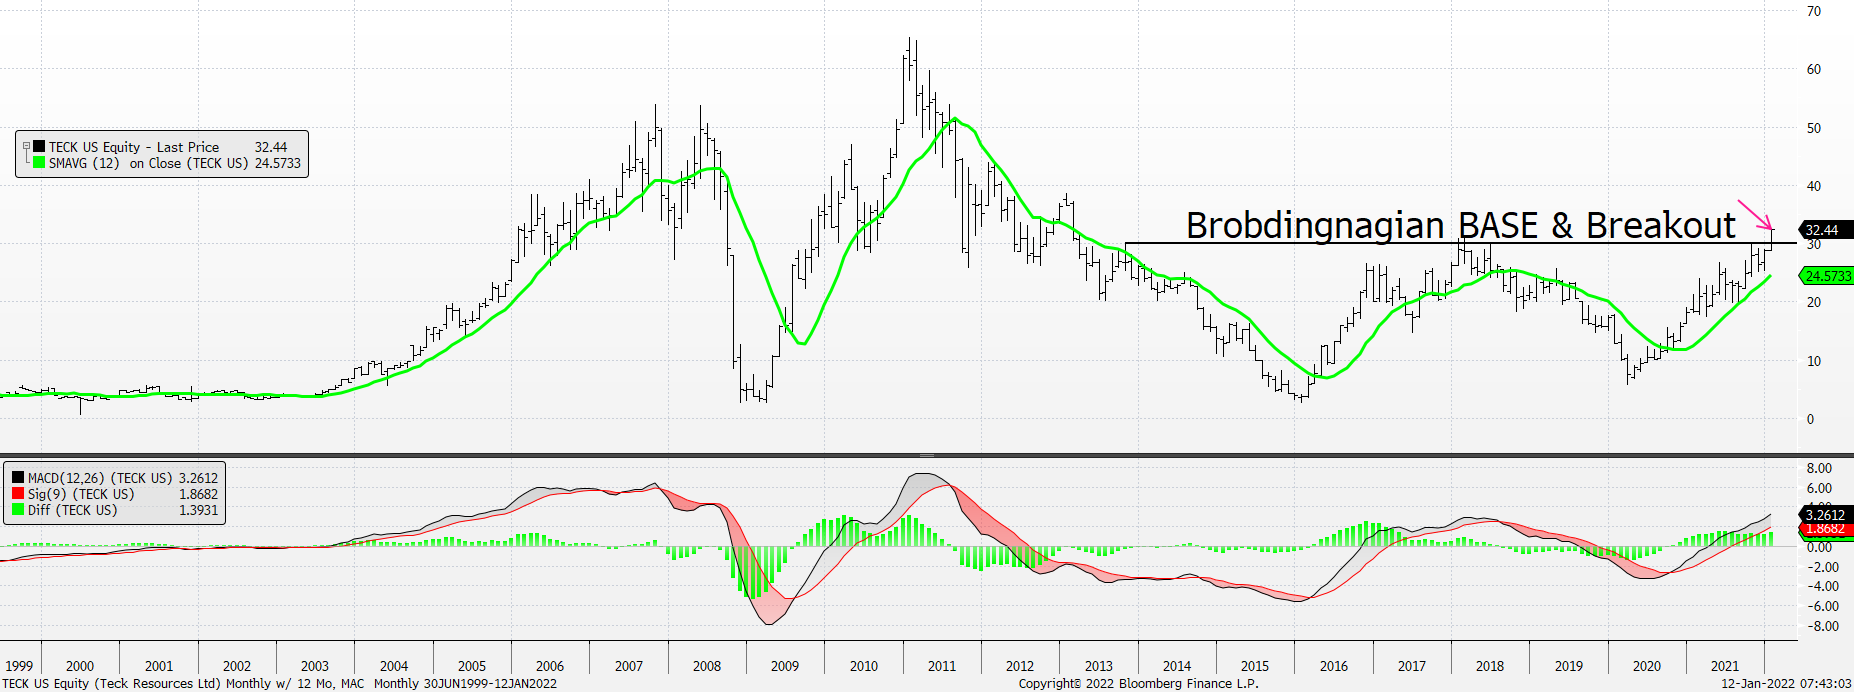
Teck Resources – Monthly w/ 12-Month Mov Avg and Monthly MACD: If we’re not buying this Brobdingnagian BASE & Breakout we’re not buying anything.
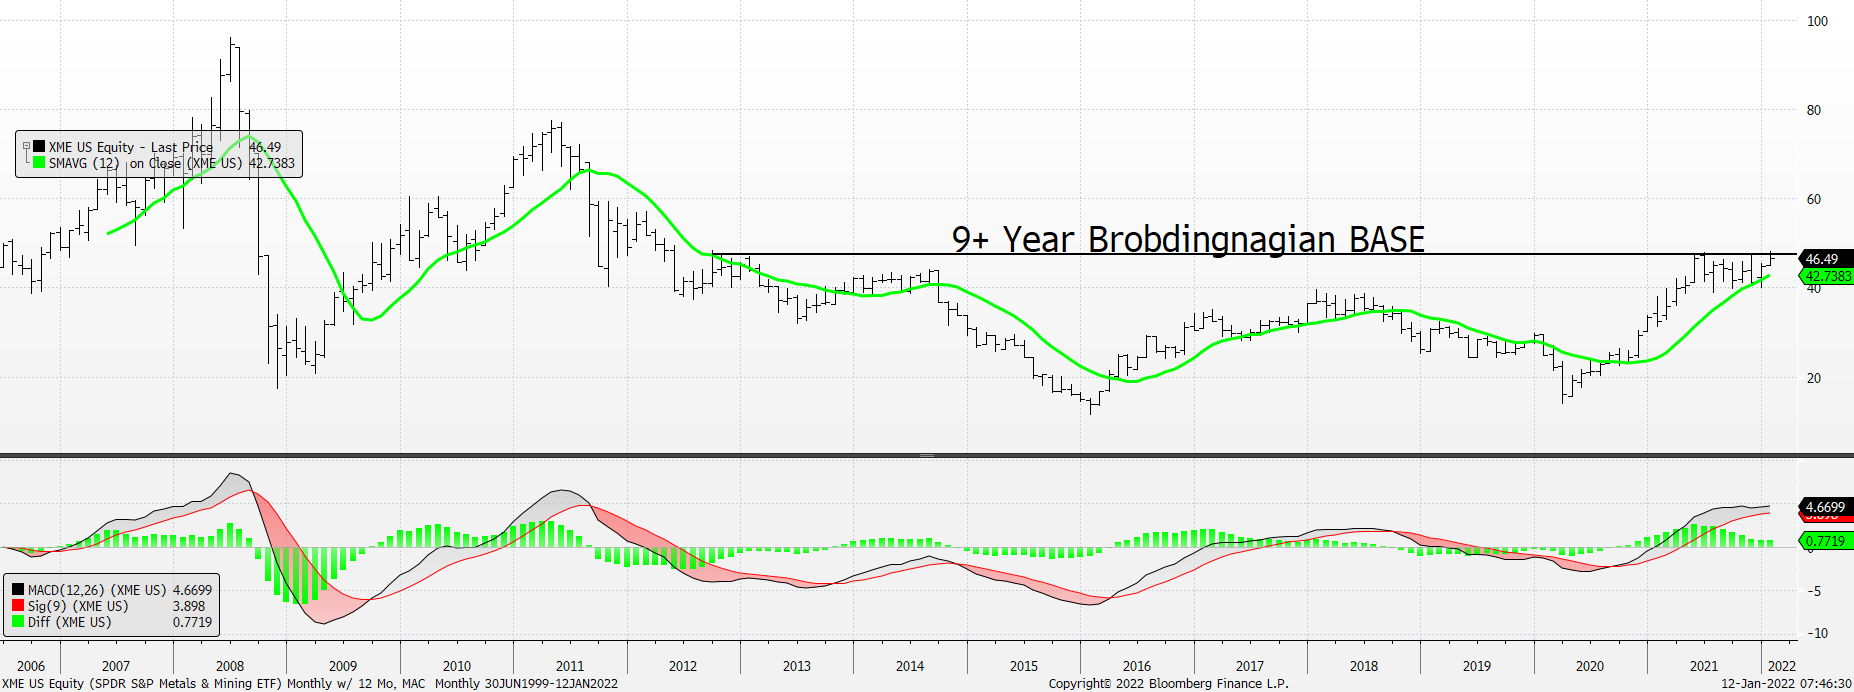
SPDR S&P Metals & Mining ETF – Monthly w/ 12-Month Mov Avg and Monthly MACD: Another Brobdingnagian BASE.