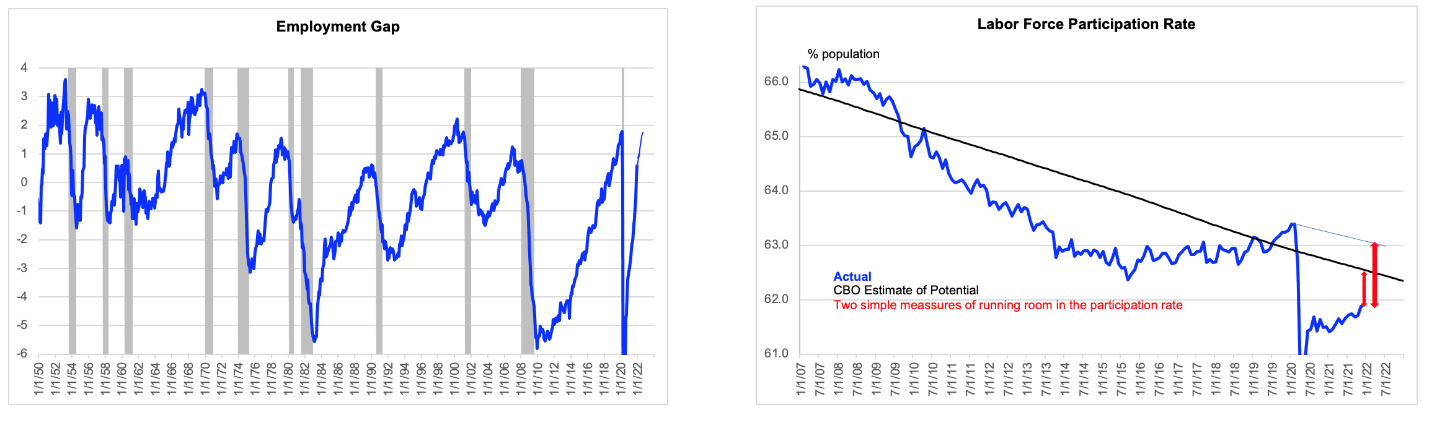
SUMMARY: Quantitative Tightening (QT) is generally expected to start in July but given the very fast tightening of the labor market and relatively strong data, there is a real possibility of rate hikes AND QT hitting in March. The base case is basically 4 hikes either way. 22V economist, Gerard MacDonell, noted that his measure of the employment gap is now on track to reach the same level of tightness as was achieved prior to the Covid shock by August of 2022. Before last Friday’s payroll data, the target date there was December 2022. Hence, the Fed might have to be much more aggressive sooner.
The above is known and arguably priced in, though and investors should consider a combination of a steepening bias in the yield curve, but a general slowing down in the rates move near term. That would favor Cyclicals over Defensives (Tech is a Cyclical) and move the conversation away from Value relative to Growth. A steeper curve favors relative size, momentum, and Cash return as well. Something to consider: When looking at the fed funds futures curve, we are starting to see a steepening (or less flattening) in the out years of hikes vs the near term (2024 hikes moved up faster vs 2022). This might be a result of the Fed focus on QT and a flatter rate hike path, which San Francisco Fed president Daly talked about last Friday.
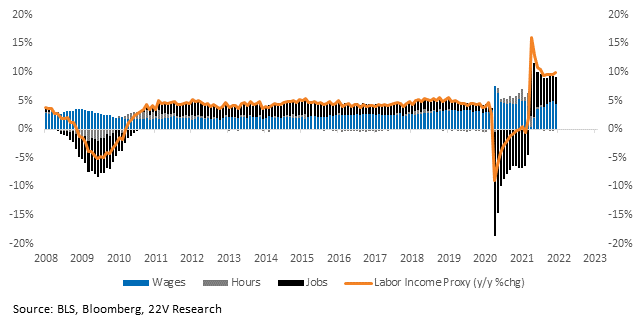
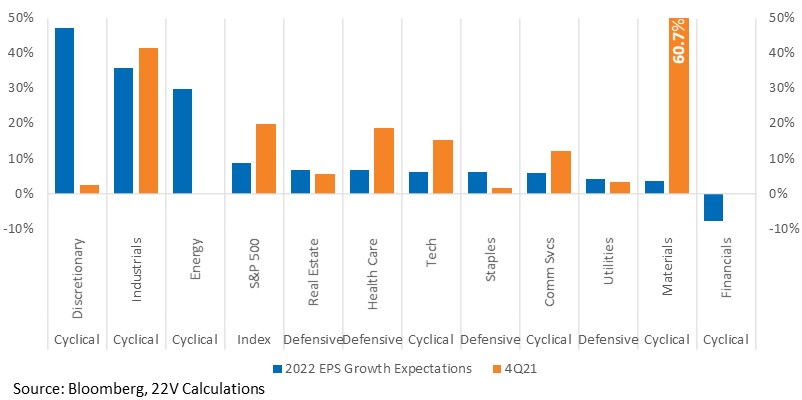
January data will be on the softer side from Omicron impacts. That will not change the general trend in underlying demand growth. The labor income proxy is still super strong, so above trend demand growth is likely to continue. See below. But data is unlikely to push short-dated fed funds futures up significantly near term. With the longer term global growth backdrop still firm (loans to Chinese companies are increasing and a stable China is important for the longer data Fed funds and 10yr) longer data rates are biased higher as investors discount a general economic reopening post Omicron. Large cap tech should find some earnings support as well. 4Q earnings reporting season starts next week.
Longer term though, the Nasdaq and large cap tech charts are in a bad trend (See John Roque’s charts and comments below) and Value, despite having 98th %tile move WoW (DON’T expect that again), relative performance of Value vs. Growth is still only in its 23rd percentile relative to history. So it has plenty of room to go. Outside of a near term disinflationary shock, the negative trends for Growth/Nasdaq will likely find support (beyond a short-term bounce) when inflation comps ease in the back half of the year. We could have higher productivity, lower rent impact and improved participation as we head into 2023.
Full report below…
MARKET VIEWS: It’s a relatively quiet night and we want to focus on the short vs longer term trends today. First, investors are pricing in a more aggressive Fed for 2022 and earlier QE. 3 ½ hikes are official priced in and most macro people we talk to think 4 hikes is a done deal. QT is generally expected to start in July but given the very fast tightening of the labor market and relatively strong data, there seems to be a real possibility of rate hikes and QT hitting in March. 22V economist, Gerard Macdonell, noted his measure of the employment gap is now on track to reach the same level of tightness as was achieved prior to the Covid shock by August of 2022. Before last Friday’s payroll data, the target date there was December 2022. Hence, the Fed might have to be much more aggressive sooner.
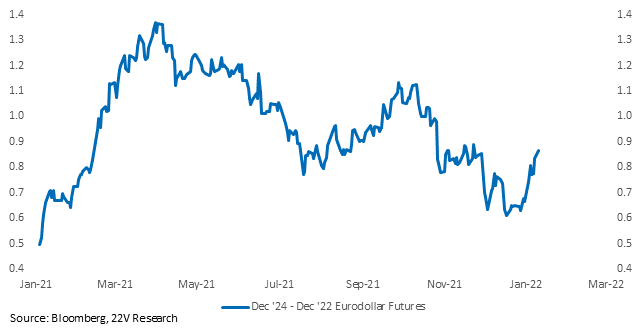
The Fed having to be more aggressive sooner is why Nasdaq and Growth has gotten hit hard. One thing to consider though, is a bias to steepen the yield curve, but a general slowing of the rates move would favor Cyclicals over Defensives (Tech is a Cyclical) and move the conversation away from Value relative to Growth. Under that scenario, a steeper curve favors relative size, EPS momentum, and Cash return as well. Something to consider: When looking at the fed funds futures curve, we are starting to see a steepening (or less flattening) in the out years of hikes vs the near term (2024 hikes moved up faster vs 2022). This might be a result of the Fed focus on QT and a flatter rate hike path, which San Francisco Fed president Daly talked about last Friday.

Data should help the steepening idea as well. Again, we are talking a bias to steepen, not a move like we had last week. January data will be on the softer side from Omicron impacts. That will not change the general trend in underlying demand growth. The labor income proxy is still super strong, so above trend demand growth is likely to continue. See below. But the data is unlikely to push up short-dated fed funds futures, significantly, near term. With the longer term backdrop remaining firm and global growth still fine (loans to Chinese companies are increasing and a stable China is important for the longer data Fed funds and 10yr) longer data rates are biased higher as investors discount a general economic reopening post Omicron.
Bottom line, a bias to steepen the yield curve near term and a general settling down of interest rates as we move through January will favor a bounce in large cap tech and earnings will likely be a support as well.
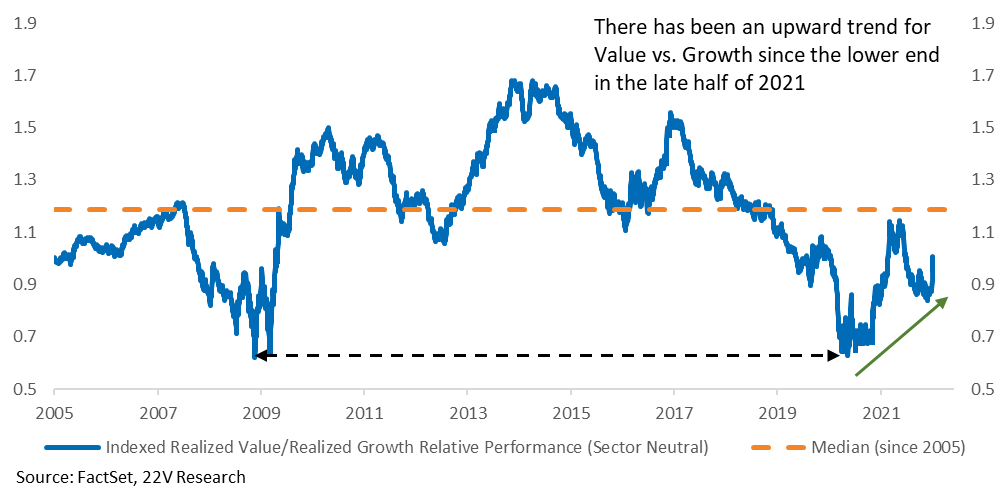
LONGER TERM: The Value rotation started in early December, but the most recent week’s gain was an extreme 98th percentile move and some near term weakness is likely. Thinking longer-term though, the relative performance of Value vs. Growth is still only in its 23rd percentile relative to history. That suggests 1) there is still room for the outperformance of Value given the tailwind from the Fed’s regime shift; 2) the pace of the rotation into Value may slow.
The rest of from our super star technician John Roque. The charts are the charts and the trends have changed for Nasdaq. We think they can bounce near term, but what gets the trends to turn around, longer term, is either a 1) much worse economic backdrop and significantly lower inflation (unlikely unless the Fed crushes things) or 2) higher productivity, increased participation and a move toward 3%ish economic growth.
From John…
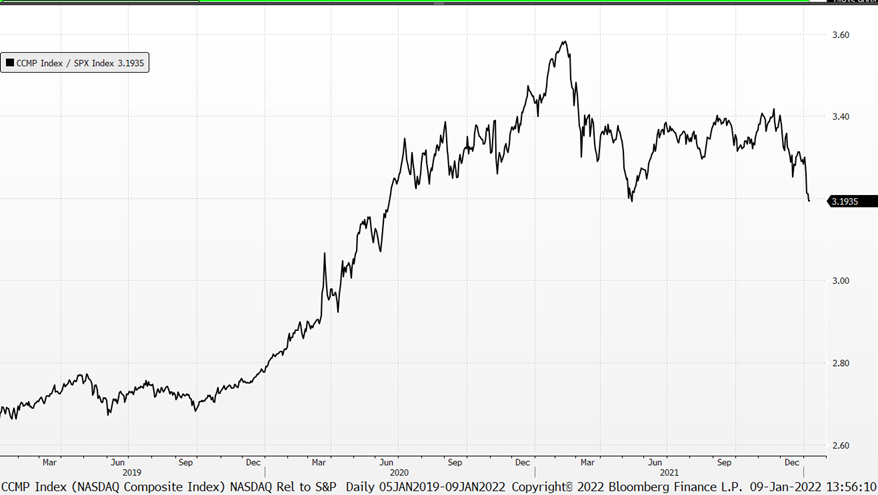
NASDAQ Relative to S&P 500: This ratio has been “Dancing on the Ceiling” (thanks, Lionel Richie) for a long time, and we continue to believe strongly that it will continue to work lower in favor of the S&P. This is a big rolling, cresting and distributive top and it is at its lowest level since June 2020. Our business is not prepared for this shift. And how can it be? NASDAQ has outperformed the S&P in 10 of the prior 12 years and the only two in which NASDAQ underperformed it did so by about 200bps in 2011 and 2016. “Don’t believe the hype” that investors are – as we’ve heard – underweight technology.
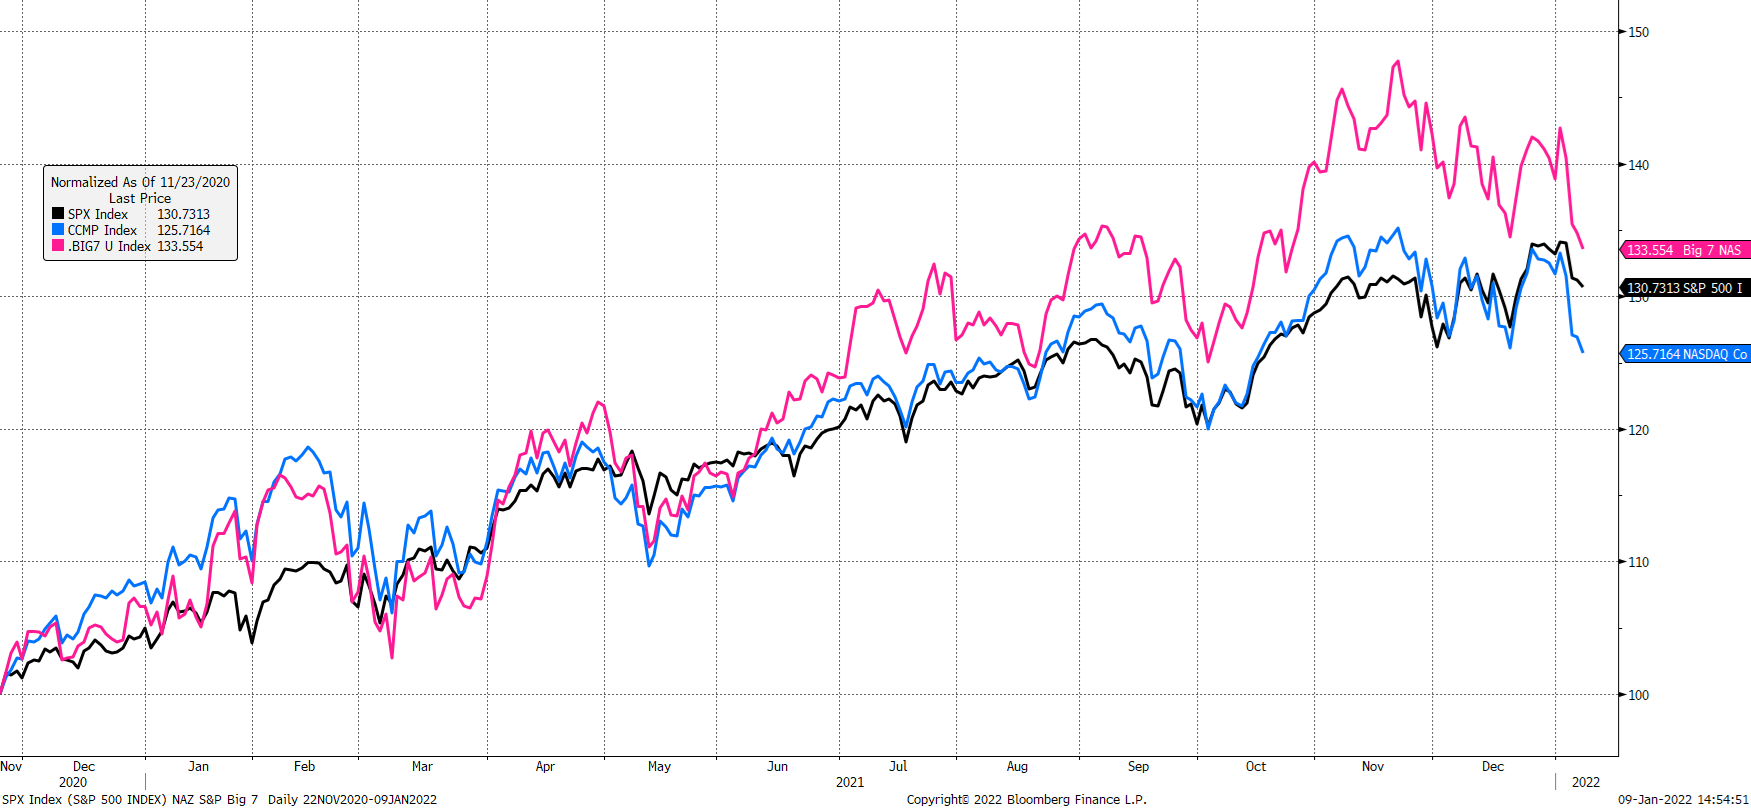
Our Big 7 Index is off 10% since its November high: The Big 7 – AAPL, MSFT, GOOGL, AMZN, TSLA, FB, & NVDA – account are for just under 26% of the S&P and just under 40% of NASDAQ. Price action is especially concerning for Amazon (Technical Score 1) and Alphabet (Technical Score 2). We’ve highlighted / lowlighted Amazon over the prior weeks and we did the same last week for GOOGL in a note entitled, “Say it Ain’t So.” We continue to believe both work lower.
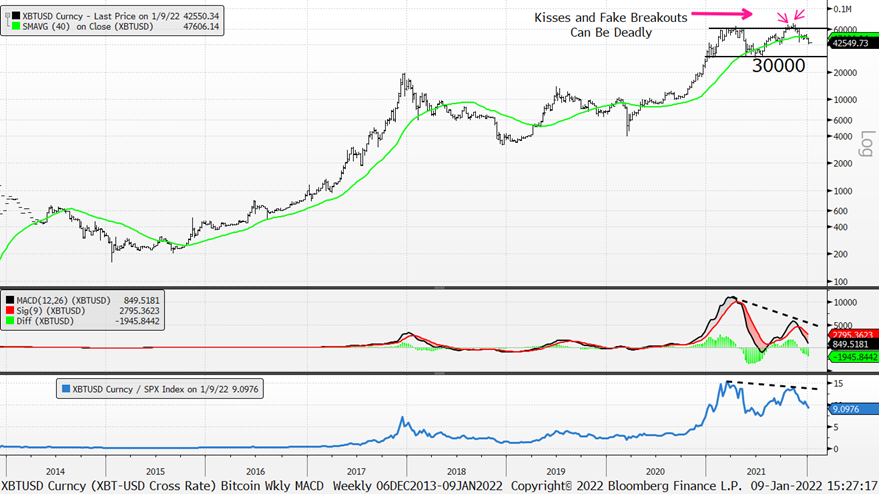
Bitcoin: If Bitcoin gets to our 30,000 target that would be its second 50% bear market since April 2021. We know it’s been volatile over its history, but two 50% bear markets in less than a year? Momentum (middle panel) continues to weaken and Bitcoin Relative to the S&P 500 (bottom panel) looks to have put in a double top.