He Jay wanted love
With no involvement
So he chased the wind
That’s all his silly life required
And the days of vanity
Went on forever
And he saw his days burn up
Like paper in fire – John Mellencamp, 1987
Via yesterday’s FOMC Minutes we learned that the Fed’s Balance Sheet “could potentially shrink faster than it did in the last cycle.” We also learned, “in light of elevated inflation pressures and the strengthening labor market, participants judged that the increase in policy accommodation provided by the ongoing pace of net asset purchases was no longer necessary.” And then there was this little pearl, “…several participants raised concerns about vulnerabilities in the Treasury market and how those vulnerabilities could affect the appropriate pace of balance sheet normalization.”
It kills us when the FOMC refers to committee members as “participants” as if to evoke an air of mystery and superiority. But it was the twice-used “vulnerabilities” that really caught our eye. They’ve finally admitted they’ve been playing with fire…Treasury paper in fire, in fact. But that’s not all that’s concerning here, QE inflated all asset prices so it seems to reason that QT – or, so far, the promise of QT – will deflate all asset prices.
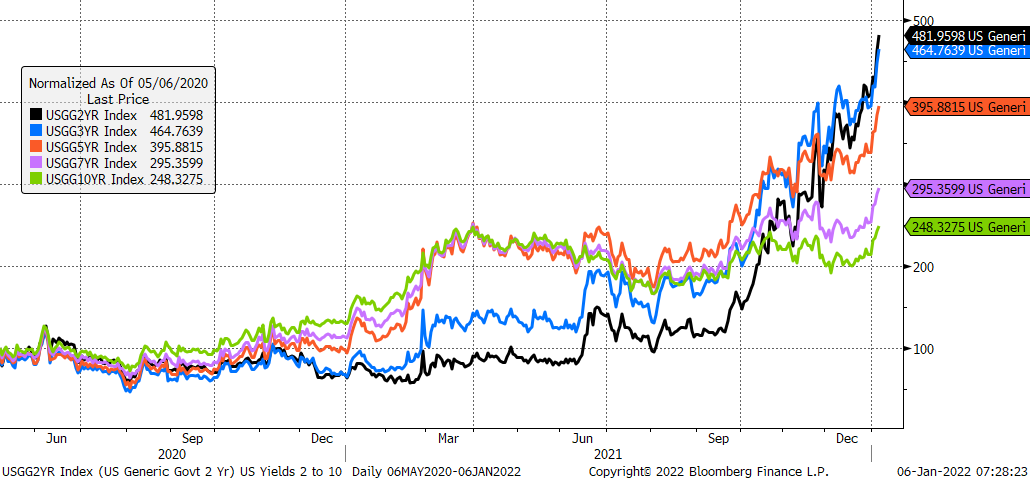
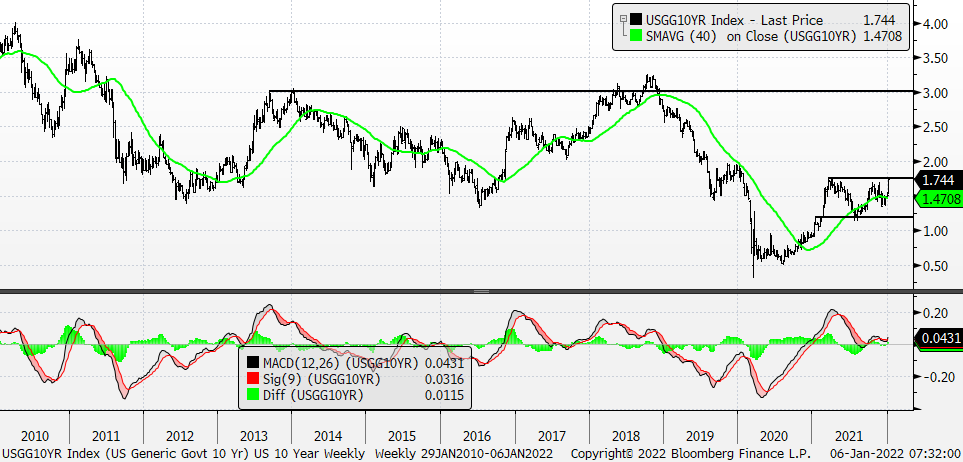
The first chart shows yields for 2s through 10s, indexed to 100 as of May 6, 2020. While 2s have been Secretariat, 3s – 10s are picking up speed, too. Since Christmas Eve, 2s are up 25%, 3s are +16%, 5s are +19%, 7s are +18%, and 10s are +17%. 2s and 3s engineered breakouts some time ago, 5s and 7s have also now broken out and so have 10s today by moving above 1.7% and its May, Oct, and Nov 2021 highs. 10s have to get above 1.77% to complete a BIG BASE. If 2s – 7s have broken out there’s almost no way the 10s won’t follow suit. We continue to believe rates will work higher than most believe – i.e., 3% (second chart below).
10 Year Yield w/ 40-Week Moving Average and Weekly MACD – top of range is 3%
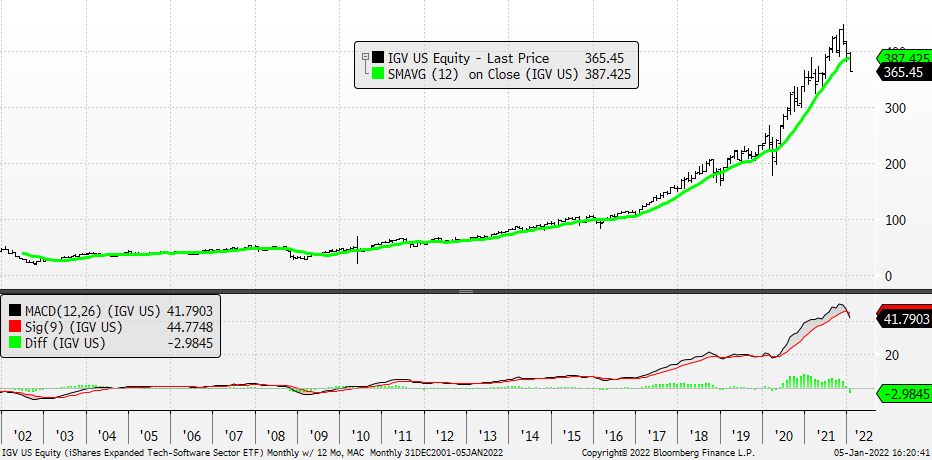
Of course, other vulnerabilities extend to high P/E stocks – we use the iShares Expanded Tech-Software Sector ETF (IGV) as our “high P/E bellwether” – and Bitcoin. The IGV is down almost 20% from its early November 2021 peak, but we believe its bear market has more to go. Here’s why: the IGV has been “oversold” since late November and it hasn’t been able to bounce / rally – the inability to bounce / rally after recording an oversold condition confirmed that it would weaken again. The 2018 and 2020 down legs were, so far, worse than the current version even though the excesses leading into this correction were more egregious. Its relative action versus the S&P 500 has broken down, too, and yet its monthly momentum is still Jimmy Cagney as Cody Jarrett in “White Heat” / “Made it Ma! Top of the world,” overbought!
This is a monthly chart for the IGV with its 12-month moving average and corresponding monthly MACD. If you knew as little about this ETF and its component stocks as we do and all you saw was that monthly MACD, would you be a buyer?
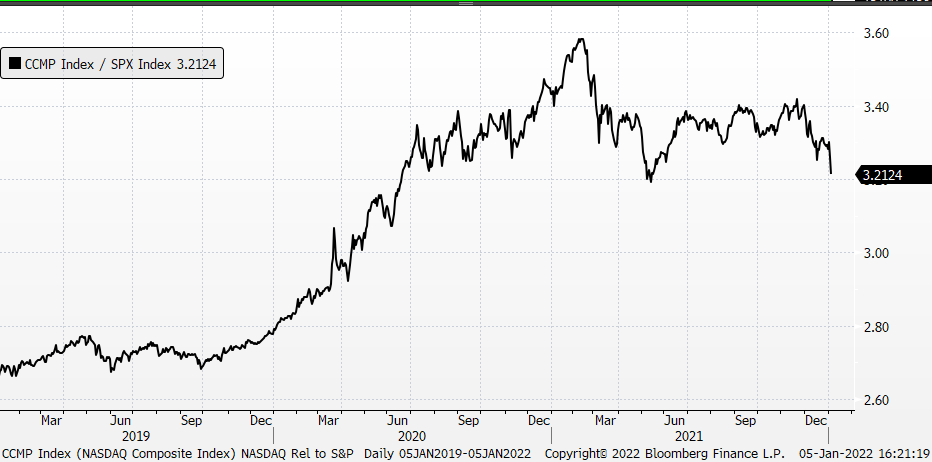
NASDAQ Relative to S&P: We are more confident than ever that NASDAQ will underperform the S&P
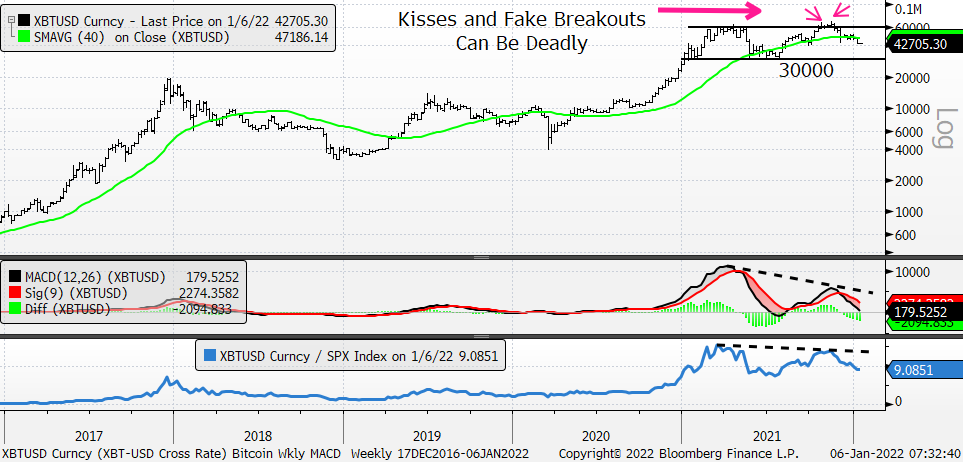
And we also continue to look for Bitcoin to break lower. Lita Ford helped us with the idea – November 26, 2021; “Kisses and Fake Breakouts Can Be Deadly” – and we believe Bitcoin has risk to 30,000. It’s additionally concerning for Bitcoin that its representative equities – Coinbase Global (COIN) and MicroStrategy (MSTR) – are weaker than Bitcoin. We’re using these two stocks as we would if they were equity related commodities and Bitcoin was the commodity.
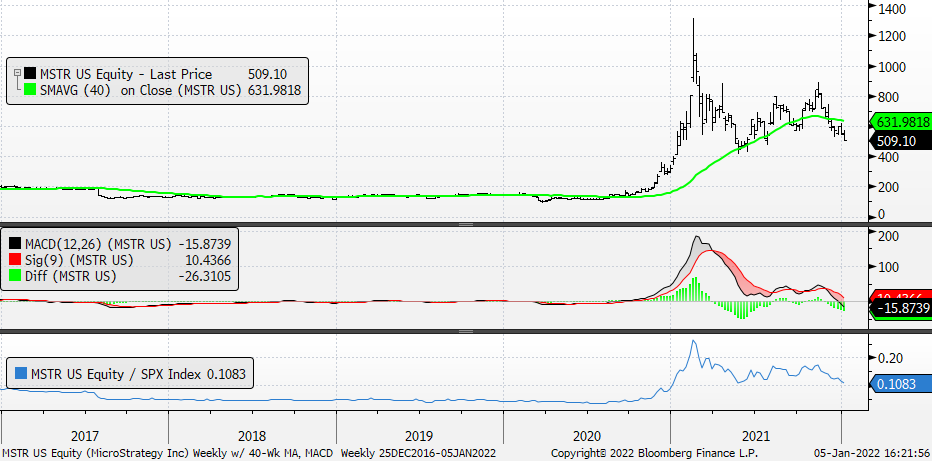
The MicroStrategy CEO, Michael Saylor, has said that MSTR’s average price for its Bitcoin holdings is $30,000. We didn’t arrive at our target price because of what he said. Rather, we’re just taking it back to summer 2021 low. We don’t think it’s a stretch to say that if Bitcoin gets to 30,000, as we suspect, then MSTR has risk to, roughly, 200. Might be worth noting that over its roughly 10 years of existence Bitcoin’s median bear market is down 78%.
Bitcoin w/ 40-Week Moving Average, Weekly MACD, and Relative to S&P 500
MicroStrategy w/ 40-Week Moving Average, Weekly MACD, and Relative to S&P 500. We think MSTR has risk to 200.
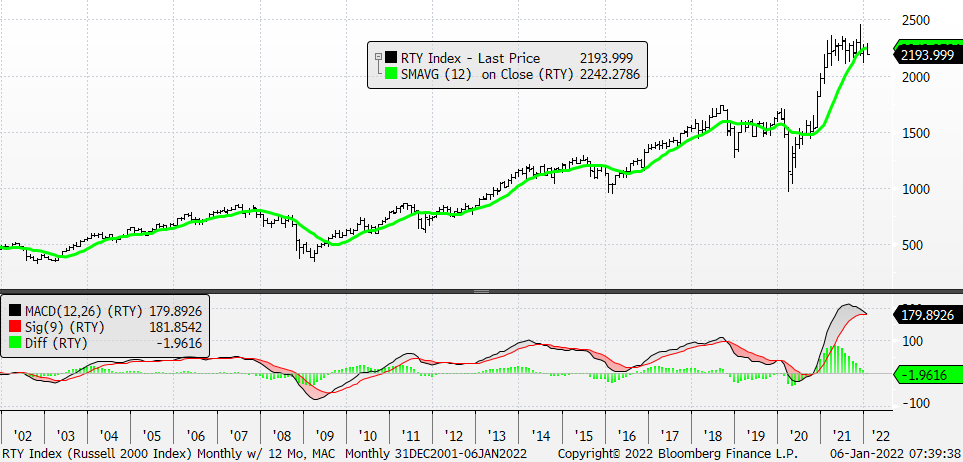
We also want to short the R2000 / IWM. Yesterday’s guillotine-like beheading for the Russell at the confluence of its 50, 100, and 200-day moving averages only adds to what our momentum indicators have been suggesting. The R2000 had built an 8-month BASE and staged a breakout in November that was quickly reversed (we hate fake breakouts) though positive momentum was evaporating the entire time. Sell any rallies in the R2000 / IWM. To repeat, sell any rallies in the R2000 / IWM. Weekly and monthly charts follow below.
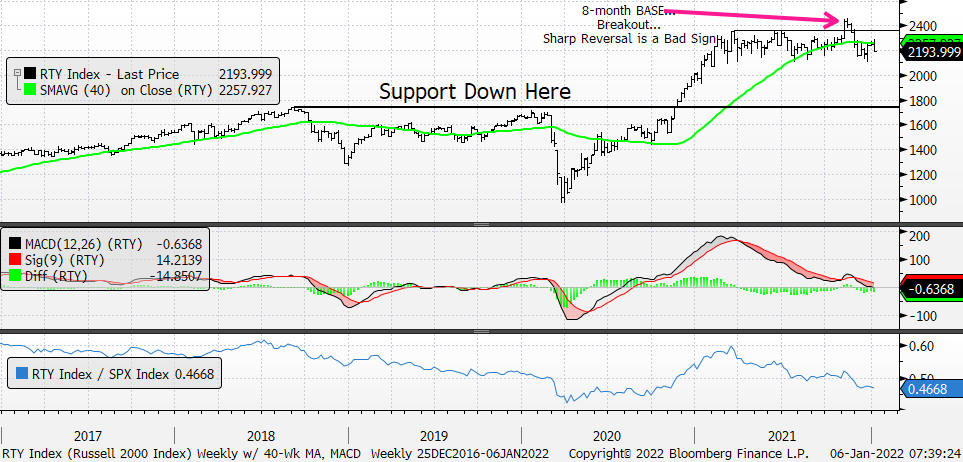
If all you saw was the monthly MACD in the bottom panel, would you be a buyer or a seller? Talk amongst yourselves.