OUTLOOK WEBINAR: We are hosting a webinar on our 2022 outlook tomorrow (1/6) at 10:30 AM ET. Registration link HERE. We will also have a replay afterwards that we are happy to send.
SUMMARY: Before extrapolating what moves in UST yields and Value mean or what should happen next, keep in mind that UST yields, the yield curve and the relative performance of the average stock are reversing dramatic moves lower that happened post-Thanksgiving. UST yields and reopening trades relative performance have been highly correlated. Omicron risk has gone down significantly, which explains the move higher in yields and reopening relative outperformance. Lower Omicron risk is also why European rates have gapped higher. The move in long rates has been global, not just US focused. That makes it tough to blame rumors of balance sheet reduction or other Fed moves for the increase in long yields.
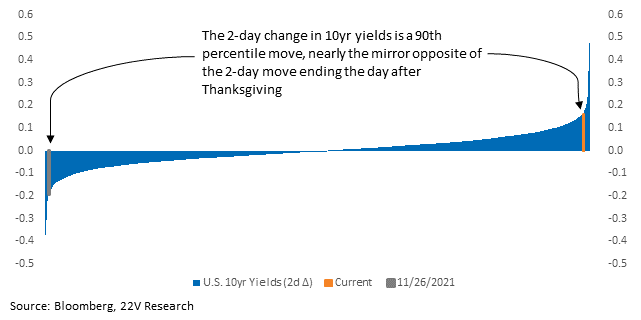
To put things in perspective, the 2-day move in 10yr yields is a 90th %tile move, nearly the mirror opposite of the 2-day move after thanksgiving. The same reversal is true for Value relative to Growth, Russell 2k relative to Nasdaq, and the average stock relative to the cap weighted index. Recall that Thanksgiving week the market had to deal with the official Fed hawkish pivot AND news Omicron was likely significantly more contagious than previous variants. At the same time, severity of Omicron was uncertain (most thought mild, but there was VERY little data) so tail risk increased significantly and long rates collapsed. The combination of faster Fed tapering, more rate hikes and Omicron was not great for the growth outlook.

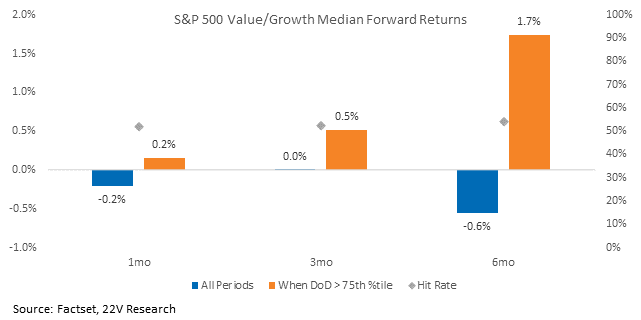
Short-term, forward returns after 75th %tile+ 1d moves in Value/Growth generally suggests outperformance continues over a 1/3/6 month period. The hit rate is a coin flip though. So, we wouldn’t draw to much of a conclusion from this. For January, we continue to like long XLE/short XLU, long Banks, long reopen, long XRT/short XLP and long QQQ/short XLP (this one has not worked but should bounce as 10yr yield settle down).
Longer term trends will become more influential as Omicron or COVID risk fades. Real rates are headed higher and investors need to position accordingly. That move favors higher cash return, value, and higher quality names. They are a headwind for low liquidity, momentum and earnings turbulence factors. Cyclicals will benefit relative to Defensives.
MOST IMPORTANTLY, if it becomes obvious the Fed needs to slow demand growth aggressively, Cyclicals will come under pressure and Defensives will outperform. They are not signaling that now and are unlikely to unless core PCE moves well above the 2.7% level the Fed has penciled in for 2022. There is real upside risk to the Fed’s 2.7% core inflation forecast, it’s a matter of how much upside risk. The payroll number this Friday will be important.
Full report below…
MARKET VIEWS: Before extrapolating the move in UST yields/Value, looking for reversal or making other high conviction calls, we need to keep in mind what happened with bond, factor, and equally weighted vs. cap weighted volatility over the past month or so. UST yields, the yield curve, and the average stock relative to the index are reversing the dramatic moves lower that happened post-Thanksgiving.
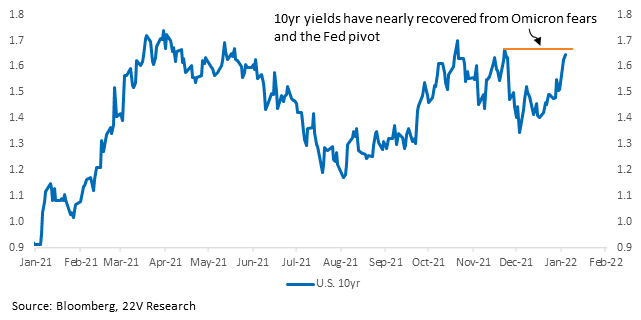
To put things in perspective, the 2-day move in 10yr yields is a 90th%tile move, nearly mirroring the opposite 2-day move after thanksgiving. Thanksgiving week investors had to deal with the official Fed hawkish pivot AND news Omicron was likely significantly more contagious than previous variants. At the time, severity of Omicron was an open question (most thought mild, but there was VERY little data) so tail risk increased significantly and long rates collapsed. The combination of faster Fed tapering, more rate hikes, and Omicron was not great for the growth outlook.
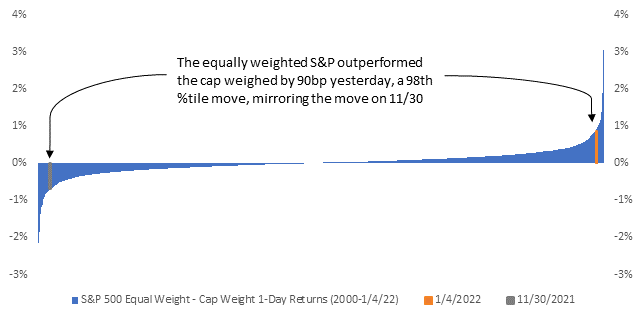
The same reversal of post-thanksgiving declines is happening with the equally weighted index relative to the S&P. Large caps surged relative to the average stock on the Omicron and Fed pivot news. Over the past week those moves have reversed.
Same thing with Value relative to Growth….
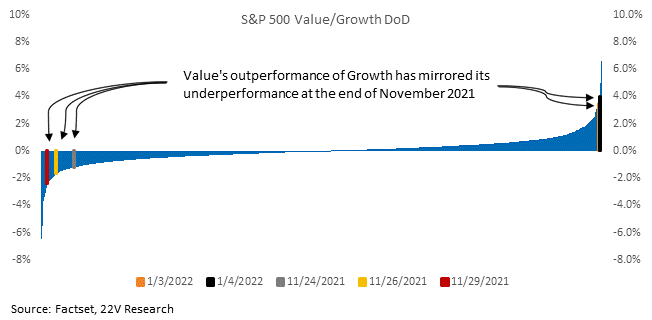
FYI…Forward returns after 75th %tile 1d moves in Value/Growth generally suggests outperformance will continue. The hit rate is a coin flip though. So, we wouldn’t draw too much of a conclusion from this.
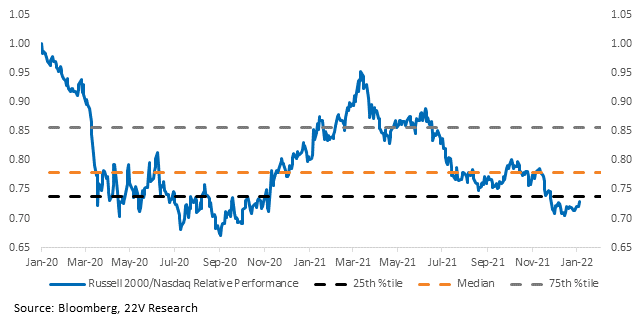
Yesterday’s +1.2% outperformance by the R2K relative to the Nasdaq was a 91st percentile move. The R2k is still extremely depressed relative to the Nasdaq, so there is still room for “catch up” by small caps if US economic growth remains firm and the Fed doesn’t crush the economic cycle.
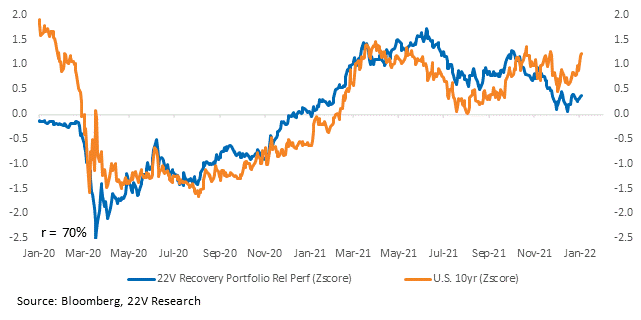
As we have noted many times, UST yields and reopening trades relative performance have been highly correlated. Omicron risk has gone down significantly, which explains the move higher in yields and reopening relative performance. Lower Omicron risk is also why European rates have gapped higher. The move in long rates has been global, not US focused. That makes it tough to blame rumors of balance sheet reduction or other Fed moves for the increase in yields.
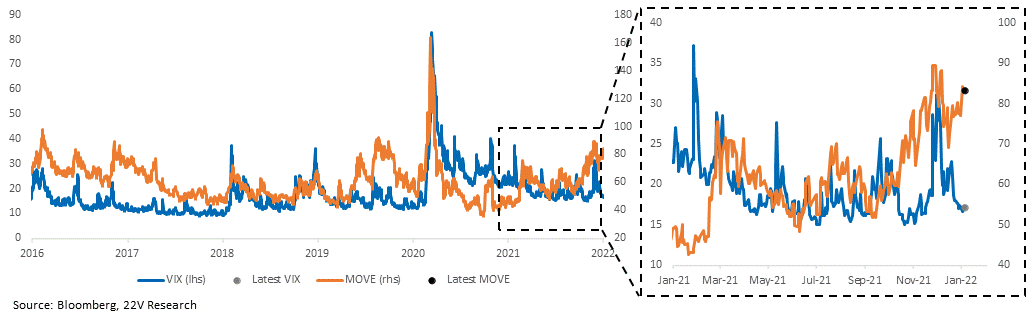
If the yield curve steepening and general move in rates is related to Omicron risk subsiding, it makes sense that stock volatility has moved down despite the increase in bond vol. The steepening of the yield curve (PMI prices paid moving lower helping anchor short rates as goods disinflation appears to be setting in) likely helped as well. Unless the payroll report suggests the Fed has to move much faster on rate hikes, expect bond volatility to settle down and stock volatility to remain low. Bottom line, what really matters for investors, now that Omicron is getting behind us, is if the Fed has to crush growth or not to drive inflation lower. If the answer to that question is yes, own Defensives. If the answer is no, Cyclicals will work.
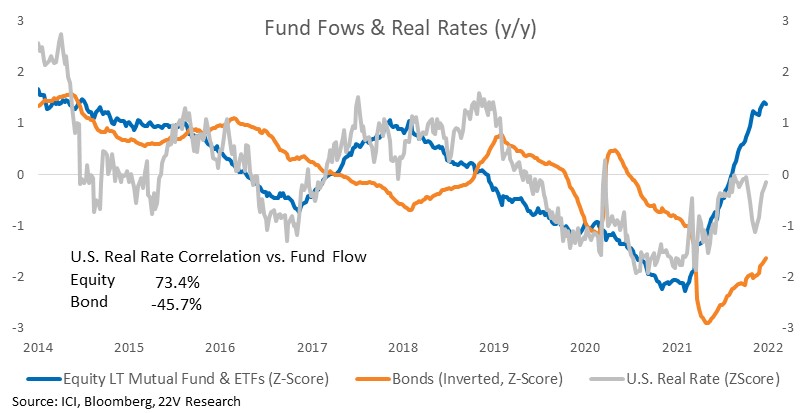
Bond Flows, Stock Flows & Real Rates: Bond fund flows are negatively correlated with U.S. real rates, while equity flows tend to rise alongside real rates. Today, real rates remain near their all-time low, the Fed is expected to hike short rates at least three times this year and has specifically mentioned they would like real rates to increase. Easing of omicron risks and steady economic growth should drive U.S. 10yr yields higher, encouraging a further allocation to equity funds.
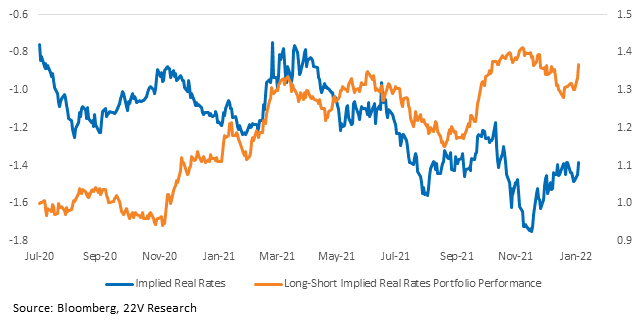
Real Rates Portfolio: Our long-short implied real rates portfolio, a dollar-neutral strategy, has returned 5% the last two days. Over the same time, real implied yields have risen +9bps, a 95th percentile two-day move since July 2020.
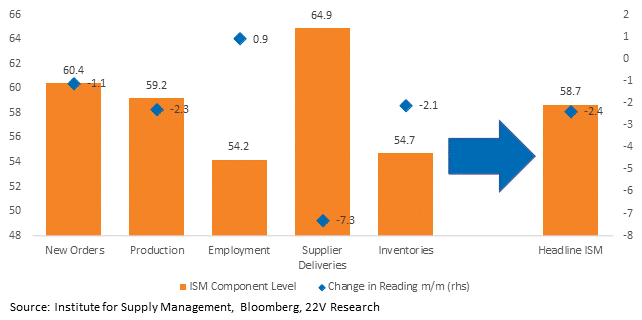
Important Supply Related PMI Point: The national ISM is a weighted average of five components; 1) New Orders, 2) Production, 3) Employment, 4) Supplier Deliveries, 5) Inventories. In December all but Employment moved lower, bring the ISM down to 58.7 from 61.1 in November. A falling Supplier Delivers reading contributed 50% to the decline in the headline PMI. Importantly, within the ISM PMI, Supplier Deliveries are INVERTED, so an easing of supply chain issues (faster deliveries) is a NEGATIVE for the PMI. So, Supplier Deliveries turning neutral (50) indicating an improvement in delivery times, would push the ISM 3 points lower.