

Source: Google Images
Only two days into the year and the talk about how “everyone is already overweight energy and materials” is at a fever pitch. Don’t believe the hype.
We’ve been promoting the non-growth (value, if you prefer) over growth thesis since the autumn of 2020 and we can tell you – with great certainty – that our idea hasn’t been well-embraced. It’s been politely entertained, but there is no way that we convinced anyone to make wholesale changes to their portfolio. It might be because we went to school in The Bronx that people can’t generally understand what we’re saying, but it’s hard for us to believe that there are portfolio managers who have sold down their tech positions to buy energy and materials positions. It wouldn’t be a stretch to believe that some portfolio managers own Freeport-McMoRan (FCX), but we’d be (pleasantly) shocked if they owned more in the way of commodity related equities.
Too, it’s been our call that an unintended consequence of an ESG mandate was to force PM’s to own more tech and to prevent them from buying equity beneficiaries of a commodity upcycle. We’ve spoken with PM’s who are prohibited from buying anything deemed “dirty” – energy, mining, etc. Talk about buying energy and mining and you just might get canceled.
During Tech’s bear market from early 2000 – September 2002 we were told, in no uncertain terms, by a uniquely famous growth portfolio manager that he “would never buy energy or materials or value.” He said, “So what if tech is going down now, when it goes up it goes up more than energy and materials ever will. I’m sticking with what I own and buying more on every dip.” Tech’s stretch of underperformance lasted from early 2000 – summer 2008, but since the summer of 2008 through September 2020 that portfolio manager was right – tech has won at nearly every turn. But no longer.
Tech Relative to Energy is at a level first seen in mid-March 2020!
Software Relative to Energy is at a level first seen in early March 2020!
Growth Relative to Non-Growth is at a level first seen in early July 2020!
The chart below shows the combined market cap weightings in the S&P 500 for Energy and Materials. In prior cycle peaks these two Sectors peaked at 22% and 20% of the S&P and at the bottom of the last cycle saw a low form in the 7% – 8% area. The most recent low figure for their combined market caps was 4.7% in September 2020 and the current figure is 5.4%.
We continue to believe that Tech is no longer monolithic, that NASDAQ will continue to underperform the S&P, that Software will continue to be a sale, and that we want to continue to buy commodities and commodity related equities.
Does anyone think our business is prepared to see Energy + Materials grow at the expense of Tech?
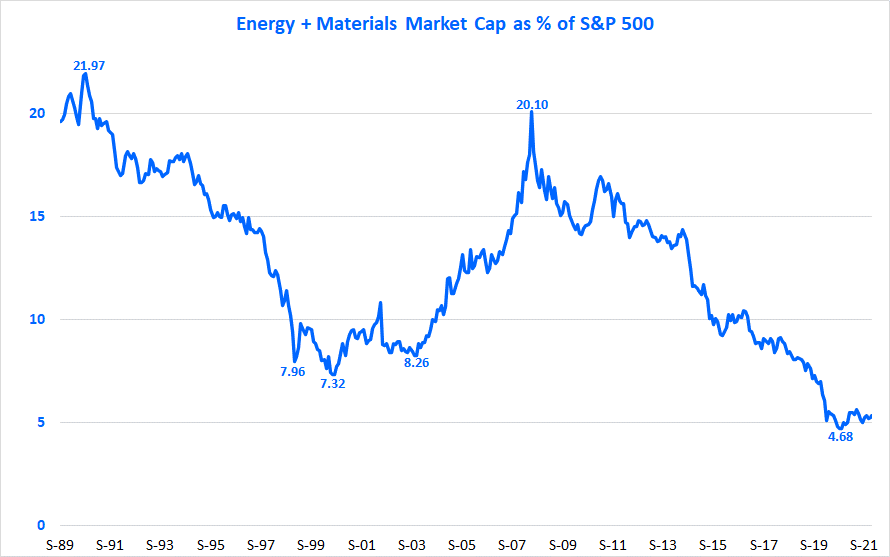
Chart Source: 22V

