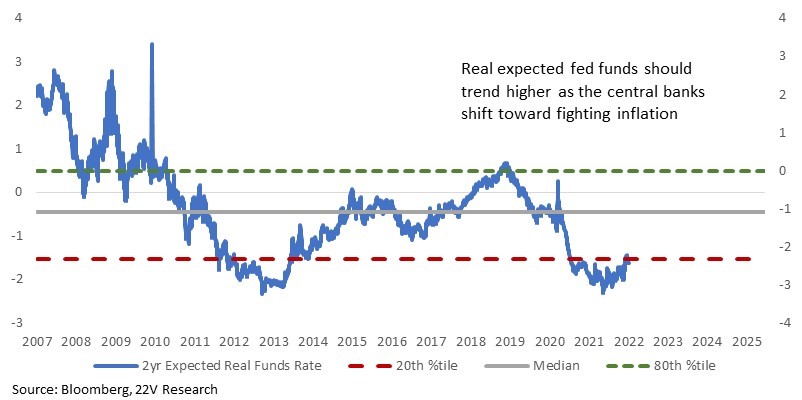
Summary:. Given the potential for continued shocks, as Gerard noted in his New Year’s Eve piece, we hope you appreciate that we do not send out a 100 page year-ahead report to get properly anchored on the wrong view amidst unrelenting shocks! As such, we are sticking to a combination of shorter-term trades around narrative shifts and a longer term framework when thinking about markets, factors and sectors.
First on the longer-term framework: Given strong wealth effects hitting the economy and a likely resumption of reopening effects, demand growth will tend to be strong and core inflation remain high, but not too high, into 2022. To put a finer point on that, markets are unlikely to come under intense pressure unless it becomes obvious the Fed NEEDS to slow demand growth aggressively. They are not signaling that now and are unlikely to unless Core PCE moves well above the 2.7% level the Fed has penciled in for 2022.
If the INTENT of the Fed shifts toward slowing growth aggressively (core inflation runs too hot), our longer-term Cyclical over Defensive call (Cyclicals outperformed in 2021 by 7.1% equally weighted), will change. Also, The Fed is data dependent and has made that clear, so guessing about quantitative tightening, or a much higher/lower funds rate, etc., is just guessing. Wait for the data and how things that NOBODY can predict like productivity and participation rates play out. The funds rate is skewed higher that is currently priced into markets. Rents and wages suggest a modestly faster pace of tightening.
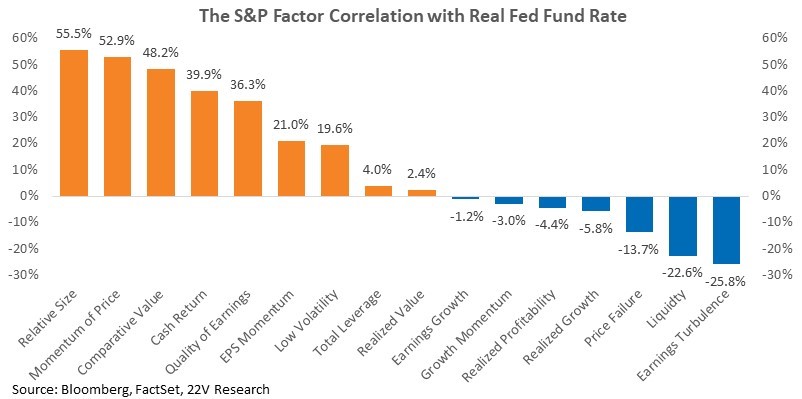
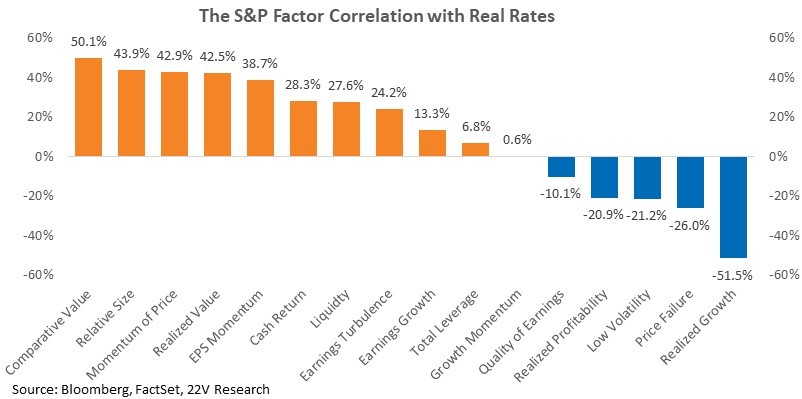
The Fed is not looking to crush growth, but they want higher real yields, and a higher real fed funds rate. Portfolios should be set up to benefit from a higher real fed funds rate longer term. As real rates increase it will favor large cap stocks, cash returns, Value and high quality. It is negative for low liquidity, momentum, and earnings turbulence.
Critical to our longer-term framework are easing supply chains, stable to improving China growth and COVID economic impacts continuing to fade.
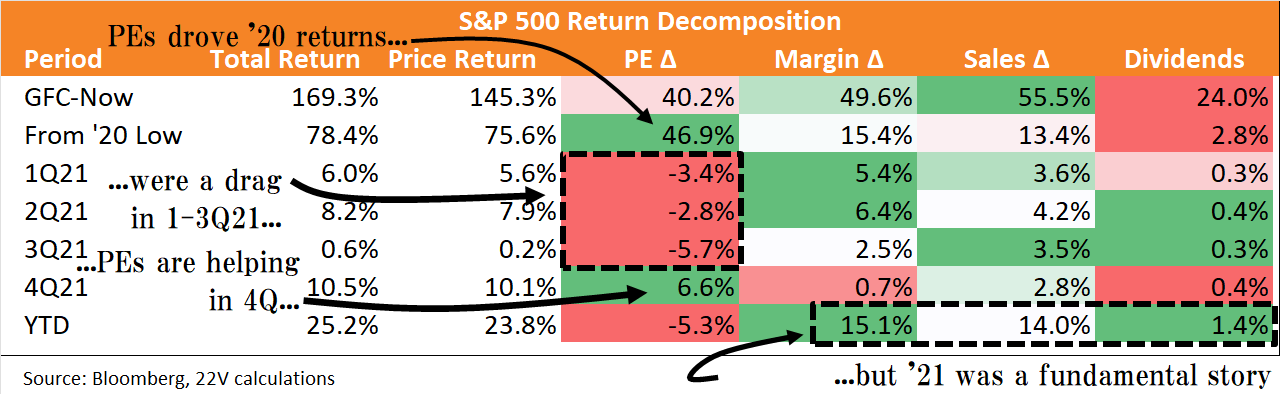
Lastly, when looking to next year it is important to keep two things in mind. 1) 2021 equity returns were almost entirely a result of expanding fundamentals. PE contraction was a 5pp drag on the S&P in 2021. 2) 4Q and 2022 earnings estimates are being revised higher, in part because analysts are increasing their profitability outlooks after two quarters of expecting declines that never came.
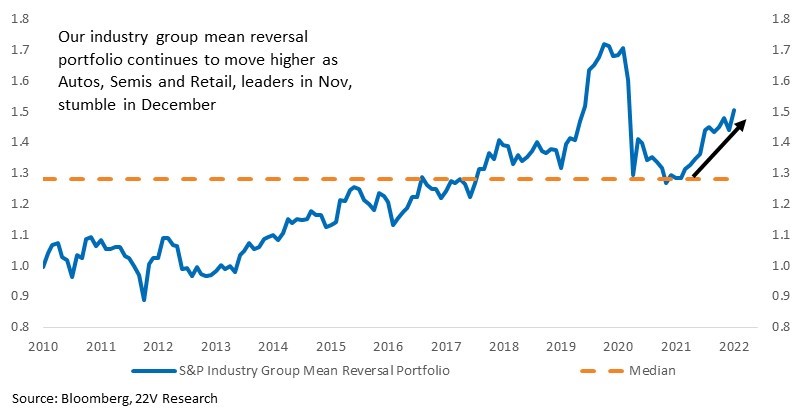
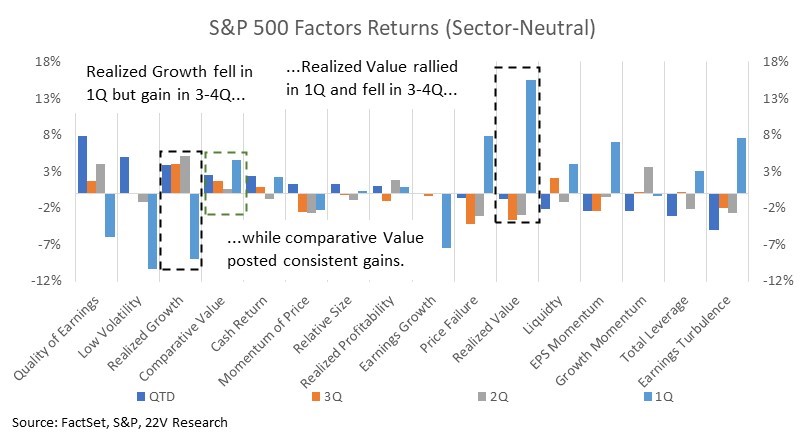
Shorter-Term: Quarter to quarter return volatility was high in 2021 and given the sensationalism around changes in inflation, new variants etc., do not expect that to change in 2022. Realized Value was the second-best performing factor, but ALL those gains came in 1Q. Realized Growth was the 4th best factor but fell sharply in 1Q and rose in 3-4Q. Comparative Value, the best factor, posted consistent gains. There are two important points about those returns; 1) there was a meaningful shift in growth expectations in 1Q and 2) identifying the short-term market regime is key to factor positioning. Also, an industry group mean reversion strategy (selling the previous months winners and buying the previous months losers) was up 18% last year.
Mean reversion and factor volatility was related to shifting assumptions about the market regime at various points in the year. As an example, fiscal stimulus and assumptions the Fed never raise rates helped Value in 1Q. Summer stagflation fears helped Growth. Reopening, Cyclicals and Growth rallied in the Fall when inflation expectations surged (when people realized a demand shock was a major supply chain problem), and momentum and earnings turbulence fell hard into year-end once the Fed pivot was internalized (higher real short rates). On the short-term narrative shift, reopening will dominate in January along with another bout of mean reversion. Auto, Semis and Retail were leaders in November and lagged significantly in December. They should rebound. We introduced trades of long XLE vs XLU, QQQ vs XLP, Banks generally and reopening on 12/22/21.
We will have an outlook piece on how to think about specific sectors and more granularly on factors, but this overview is a good way to get a sense on how we think about things.
Full report below…
Shorter Term: Auto, Semis and Retail were leaders in November and lagged significantly in December as the Omicron uncertainty increased and the Fed pivoted. Any security that was high beta or levered to improving economic growth suffered as a result. Defensives outperformed significantly.
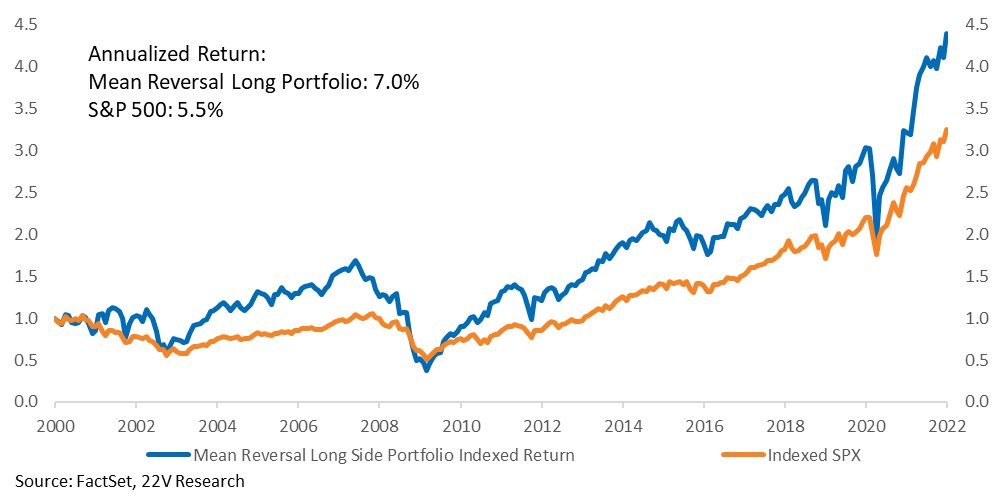
As we noted in a report, a mean reversal strategy has also been effective at the stock level. We constructed a S&P mean reversal portfolio that is long the bottom 100 stocks from the previous month and short the top 100 performers. Back test results show the strategy outperformed, especially the long side, which has posted a 7% annualized return, exceeding the S&P’s 5.5% return since 2000. This year the long portfolio performed extremely, gaining 36.8% YTD.
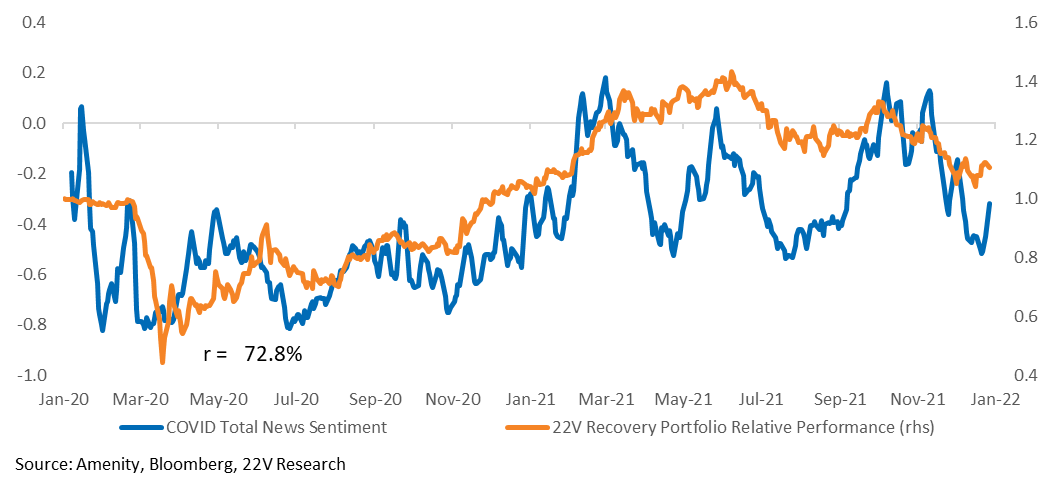
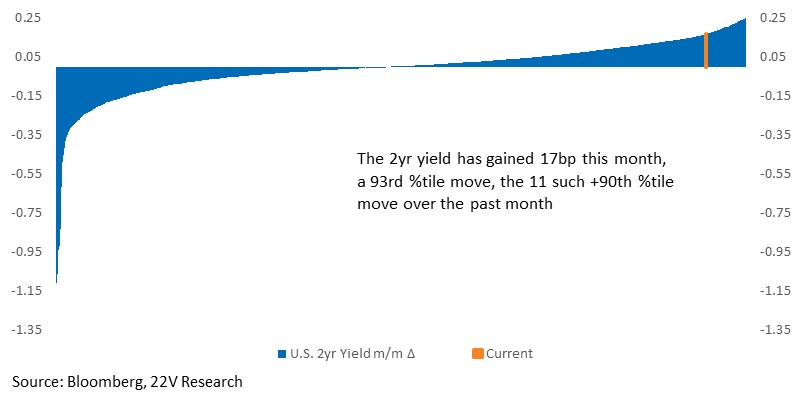
COVID news sentiment is starting to improve, which is helping bond yields trend higher. Omicron has been a significant headwind to Treasury yields, which are used as chaos hedges, and reduction of virus-induced left tail risk takes downward pressure off yields. Recovery stocks have been also moved lower as COVID risk spread and countries introduced renewed restrictions. Recovery headwinds will remain near term, but the outlook for those stocks is improving.
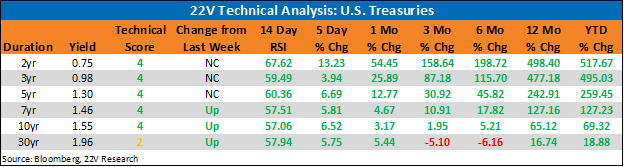
John Roque, 22V’s technical analyst, pointed out the positive setup for U.S. treasury yields across the curve yesterday. Treasury yields from 2 to 10yrs have technical scores of 4 (the best score they can have). John expects yields to work higher across durations. 2s have been strong with corresponding and in agreement momentum gauges. 5s are building to a breakout but still BASING or consolidating. 10s are behind both 2s and 5s as its consolidation or BASE is much less aggressively formed than is that for the 5s.”
the 10s-2s and 5s-2s curves have been flat. As we noted a few weeks ago, the worst of the yield curve flattening is likely over. As Omicron concerns fade, downward pressure on longer date yields will ease, paving the way for steeper curves in 1H22. An improvement in China’s economic outlook would likely support some short term upward pressure on yield curves as well. Chinese media outlets and interviews with policymakers continue to indicate more stimulus is coming. China levered stocks (Industrials which have lagged come to mind) would benefit from an improved China outlook.
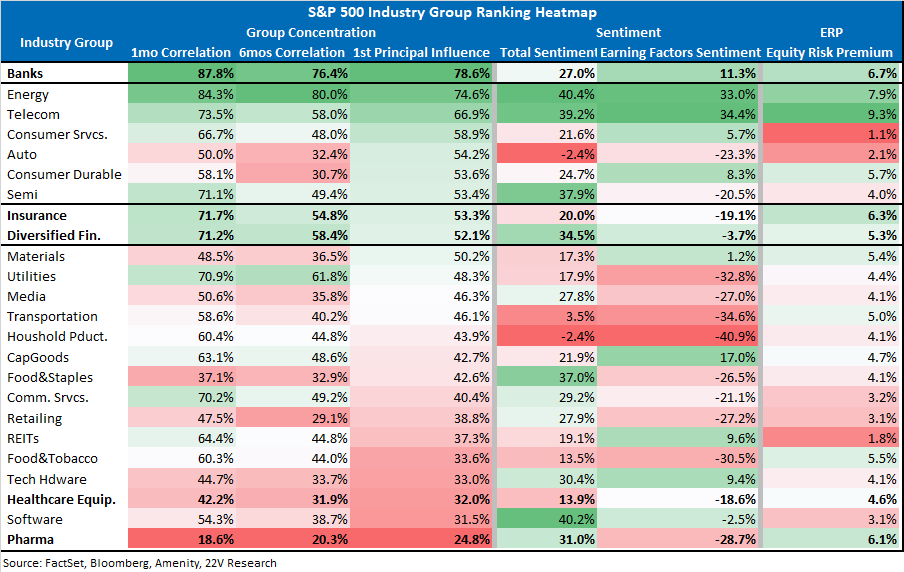
From a technical standpoint, shorter durations have better setups than longer durations, which is consistent with fundamental upward bias to shorter dated yields given the shift in fed policy. Rising bond yields an and important support for Financials industry groups. Financials industry groups tend to be highly influenced by macro forces and that is particularly true today.
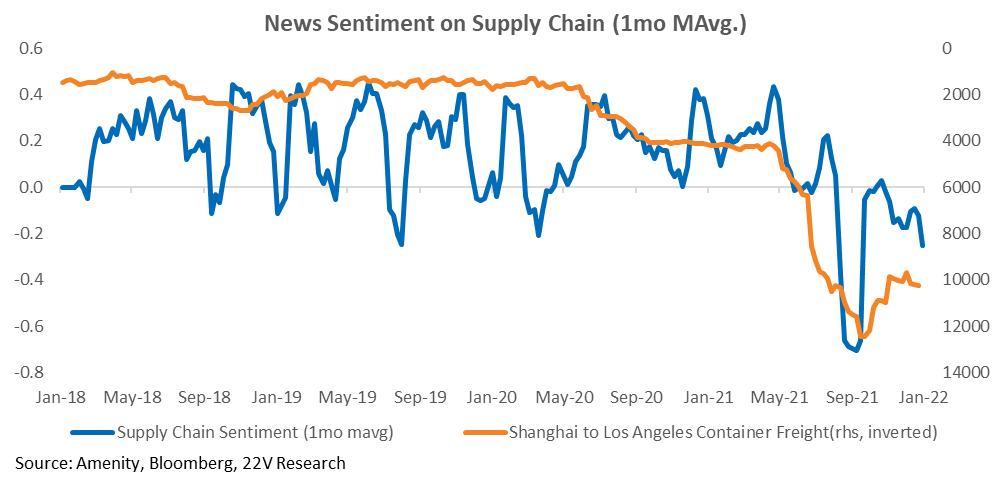
Near-term risk: A near-term risk to the yield curve and China levered names is that supply chain sentiment is worsening again and China’s zero COVID policy COULD be a major headwind. In addition to the news of China shutting down certain districts last week, Cathay Pacific reported it would suspend all long-haul cargo flights after quarantine rules were increased from 3 to 7 days. Supply chain concerns intensifying in January and goods inflation remaining elevated (most economist assume goods deflation will start to offset core inflation pressures), concerns about sticky high inflation leading to demand destruction will increase again. It won’t be as intense as this past summer (other countries are keeping factories open and this wave of shutdowns is not happening right in front of the holiday), but it will be a narrative the bears latch onto. We still think supply chains ease and want to own the companies that benefit from easing supply chains, but we wanted to point out the risk.
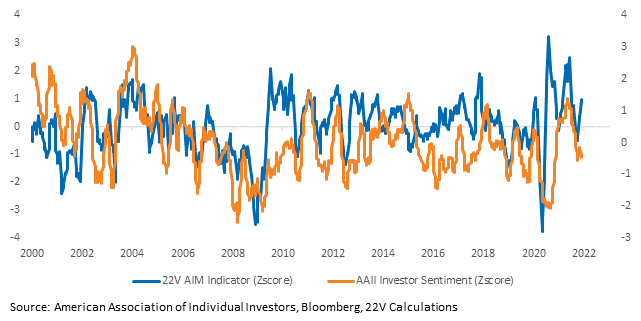
Market sentiment: The overall market is unusually weak relative to the breadth of economic data. That typically leads to much stronger than normal forward returns. The spread between sentiment and data has been wide for a few weeks but was overwhelmed by Omicron/Fed fears. As those fears fade, negative sentiment should reverse and lead to stronger than normal support equities on a 1 and 3 month basis.
Longer-Term fundamentals: For most of the year there was a debate surrounding the influence of monetary policy on equities, which was a continuation of the persistent debate since the end of the Financial Crisis. Monetary and fiscal policy undoubtedly had a positive impact on short term economic activity, which was the goal of said policies. But market returns were NOT a result of increased risk appetites. They were a result of improving fundamentals. U.S. equities were up 25% (ln) and PEs subtracted about 5pp from the S&P in 2021 gain.
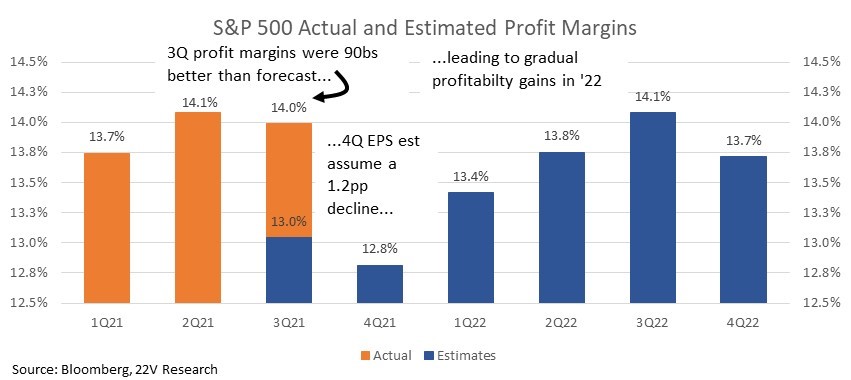
Changes in risk appetites could shift the return profile for next year and we expect a lower equity risk premium (our preferred valuation methodology) will support stocks. But fundamental supports are forecast to remain strong and those estimates have been moving higher over the past month. Earnings estimates are being revised higher in part because margins estimates are moving higher. Margins have consistently beat expectations and the bar heading into 4Q reporting season is unusually low.
Long real funds rate beneficiaries: Investors need to position for higher real yields and the higher real fed funds rate. Rising real rates favor large cap stocks, cash returns, value and high quality. They are a headwind for low liquidity, momentum and earnings turbulence.
FYI…factor correlations with 10yr real yields are different in important ways relative to the factor correlations with real fed funds. In short, when 10yr real rates go up, quality, low volatility and profitability factors underperform. As the 10yr yield becomes more competitive with other assets, like high quality stocks, those names suffer on a relative basis. If 10yr yields increase because economic risk is lowered, that likely helps lower quality names as well.
Factor vol: Quarter to quarter return volatility was high in 2021. Realized Value was the second-best performing factor, but ALL of its gains came in 1Q. Realized Growth was the 4th best factor but fell sharply in 1Q and rose in 3-4Q. Comparative Value, the best factor, posted consistent gains. There are two important points about those returns; 1) there was a meaningful shift in growth expectations in 1Q and 2) identifying the market regime is key to factor positioning.
On regimes, Value and Growth had major swings depending on the perceived market regime during 2021. Fiscal stimulus and expectation the Fed would never raise rates helped Value in 1Q. Summer stagflation fears helped growth. Reopening, Cyclicals and Growth worked in the Fall when inflation expectations surged (that is when people realized a demand shock was a major reason for supply problems) and momentum and earnings turbulence fell into end the year once the Fed pivot was internalized (higher real short rates). As we have noted before, one clear trend for 2022 is the upward bias to expected real rates as the fed and other global central banks shift from pursuing to fighting inflation. On the short-term narrative, we think reopening will dominate in January, but supply concerns could offset that. We remain long XLE vs XLU, QQQ vs XLP, Banks generally and reopening.