If you owned Freeport-McMoRan (FCX) at the start of the year and through its May 10 high you know that it was on fire with a gain of 64%. At that time, it was the 9th best performing stock in the S&P. However, since peaking in May the stock has been consolidating which included an uncomfortable 35% drop into the third week in September. In retrospect, the corrective phase was understandable as the stock – like Usain Bolt – needed to recuperate and rest after sprinting all out.
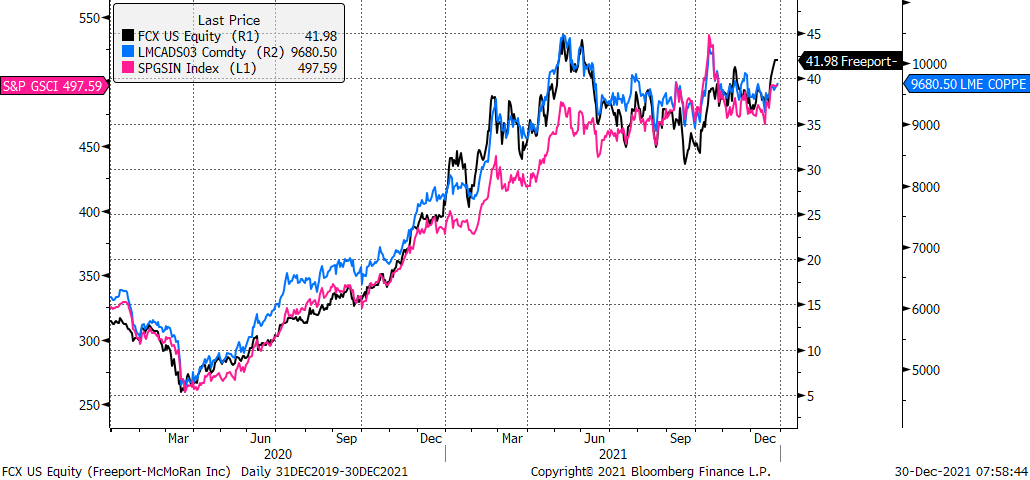
We’ve been fans of the commodity complex – physical and equity beneficiaries – for some time, and Freeport-McMoRan has been a particular focus for us as we believe it has bellwether characteristics for the Basic Materials Sector and because copper is the Capo di Tutti Capi for Base or Industrial Metals. The chart here shows FCX, copper, and a Base Metals Index are directionally correlated.
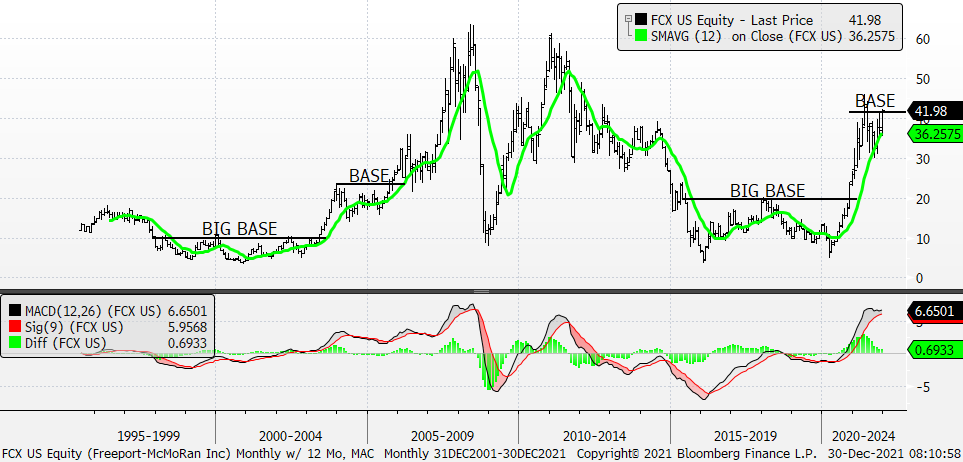
FCX has a Technical Score = 4, has been BASING for eight months, is above upward-sloping 50 and 200-day moving averages, and sports positive momentum across all periodicities. The stock’s all-time high price occurred in 2008 when it peaked just shy of 64. We’re looking for the stock to break out of its current BASE and work to a new all-time high. It certainly helps us to know that over its history FCX has had three of its four biggest advances after building BASES and breaking out. The monthly chart below will show you what we mean.
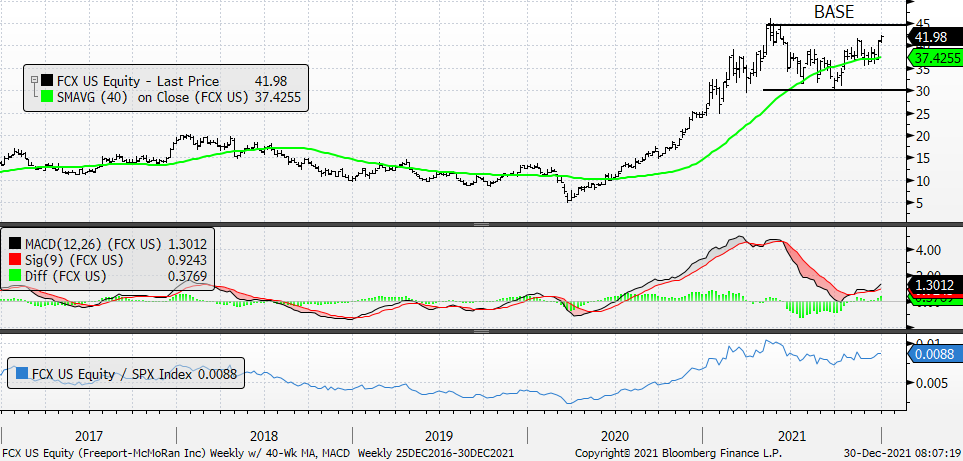
Weekly chart for FCX –
Top panel: FCX with upward-sloping 40-Week Moving Average; 8-month BASE
Middle panel: Weekly MACD has inflected upward
Bottom panel: FCX / S&P BASING
Monthly chart for FCX –
Top panel: FCX with upward-sloping 12-Month Moving Average; 8-month BASE
Bottom panel: Monthly MACD has been consolidating at an elevated level. Some will certainly say that this indicator is overbought – and it is. However, we’re going to interpret this reading as a sign that the stock is strong, has stayed strong, and will get stronger.