
Our entire repository of COVID charts is HERE.
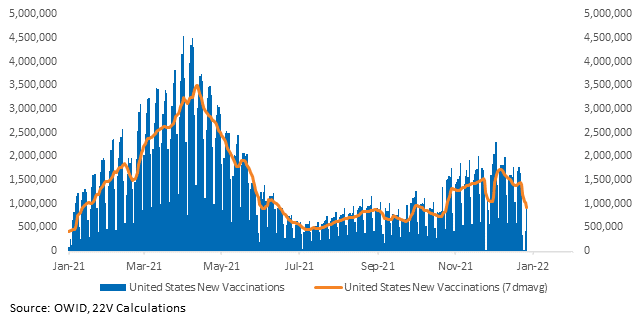
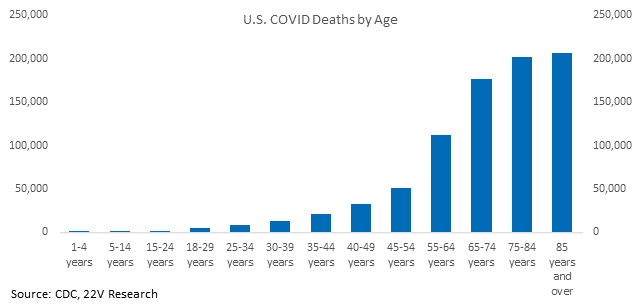
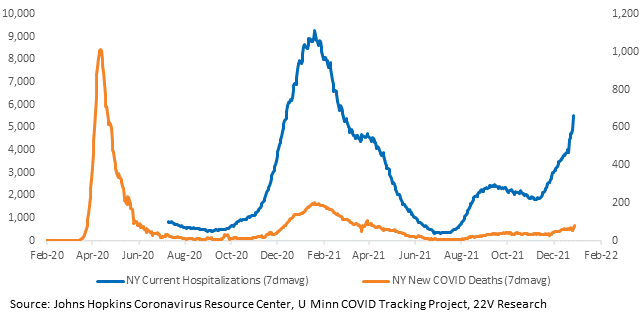
There is a breadth of data suggesting Omicron is significantly less severe than prior strains, whether by its nature or from prior immunity/protection. A new study from South Africa concluded J&J’s booster significantly reduces hospitalizations. The recent findings echo studies of Pfizer and Moderna’s efficacy against severe disease. Boosters dramatically reduce hospitalization risk and, as we have been saying, severe disease will have the largest effect on behavior and policy. Plus, new therapeutic treatments are highly effective at reducing severity. The worst-case scenarios are off the table. Only 21% of the population has been boosted and daily vaccinations have been lagging recently (likely because of the holidays) but 53% of those 65+ have been boosted, and 65+ have accounted for 75% of COVID deaths. The demographic breakdown of boosters is encouraging.

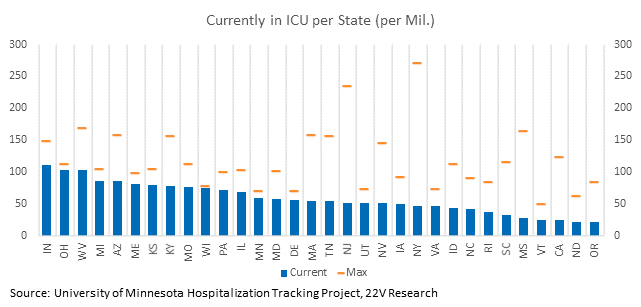
Deaths lag case growth by about three weeks, so data starting around now should be telling. ICU utilization, which lags by less time and as such is more useful right now, is below the peak for every state we have data for. Some states in the Midwest are close, but given all the above, there is reason to be optimistic.
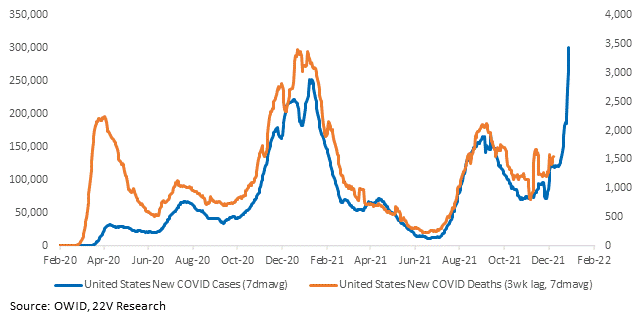
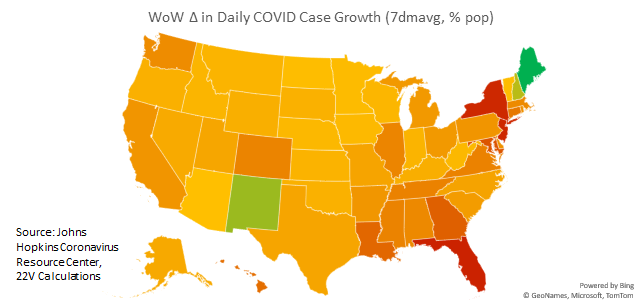
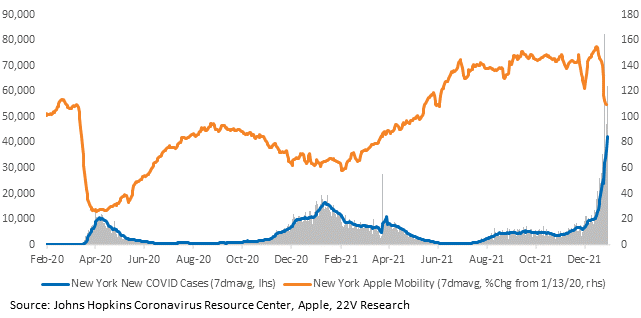
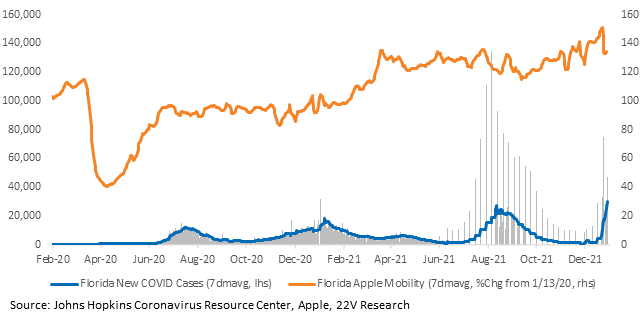
Case growth data in the US is through the Christmas lag (right before a New Year’s lag). The worst case growth is in the NYC metro area and Florida, though cases are increasing almost everywhere. Mobility data is being affected by Christmas.
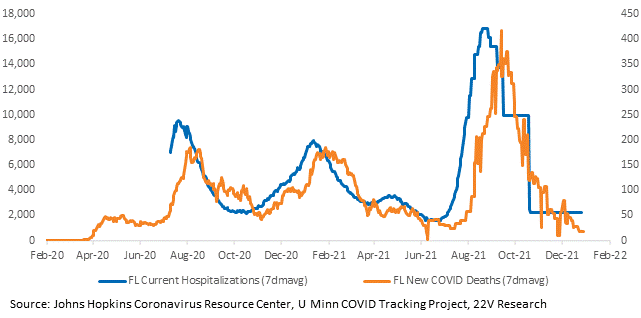
Charts for every state and country we have for are HERE.

