It might’ve been the linguini with clam sauce (it really was terrific) on The Feast of the Seven Fishes (Festa di sette pesci) or La Vigilia (The Vigil) that got the juices flowing, but it was more likely the wine that loosened the tongues of one particular dinner guest because it was only after his second glass that we heard him say, “Investors are way too bearish. This market’s going higher.” We said, “The market’s at an all-time high and investors are bearish? If your judgment is this cloudy after only two glasses, how can I trust you to drive home?”
We are truly in a post-sentiment world, and in need of some emotional rescue, if the market can be at an all-time high and investors can be thought to be bearish. What would happen if the major indexes declined 10% or more? What would sentiment be like then? Or would apoplexy be the order of the day if the S&P and NASDAQ were to be in a bear market?
Sentiment, like indicators, have always been hard to interpret and even harder to apply to “the market.” And it’s become especially difficult to do in this era where the Big 7 Stocks (AAPL, MSFT, GOOGL, AMZN, TSLA, FB, & NVDA) are nearly 27% of the S&P and the same stocks are 40% of NASDAQ. Just a decade ago five stocks – XOM, AAPL, IBM, CVX, and MSFT – were only 12% of the S&P! We feel it’s safe to say that never before have so few stocks been so dominant or represented such a big slice of the major indexes.
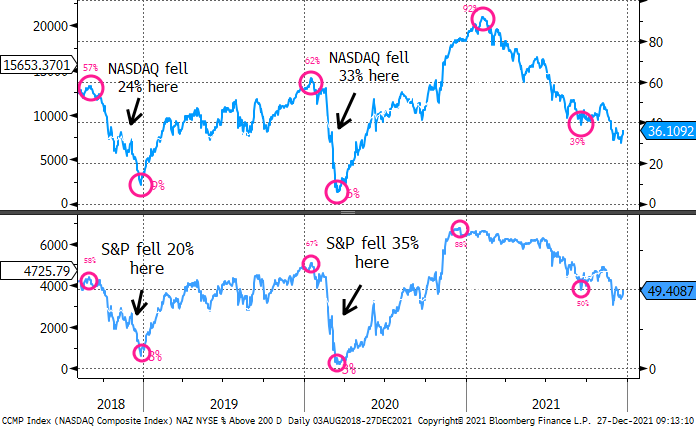
In a perfect example of why we believe that indicators are to be used to manage net exposure and do not provide insight into what the indexes are doing or will do, consider the following chart which shows the % of NASDAQ Stocks Above Their 200-Day Moving Averages (top) and % of NYSE Stocks Above Their 200-Day Moving Averages (bottom). The most recent data show that only 36% of NASDAQ stocks are above their 200-day moving averages yet the index itself is a bit more than 3% from a new high and 50% of NYSE stocks are above their 200-day moving averages and the S&P is at a new all-time high. In just the prior two cycles you can see how much both NASDAQ and the S&P dropped when this indicator was deteriorating. Yet the Big 7 Stocks shrug off internal concerns much like Michael Jordan used to blow past would be defenders.
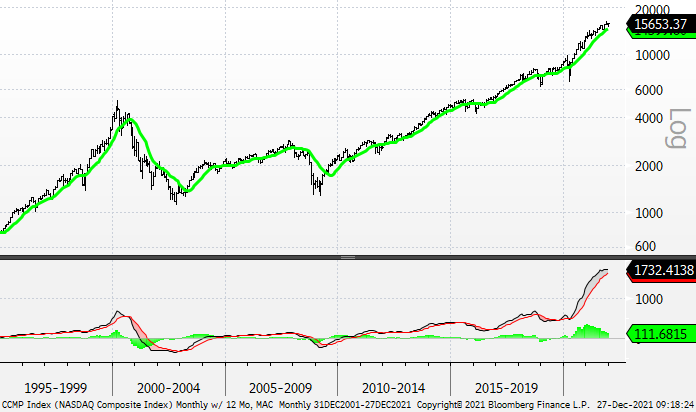
For a long time, we’ve said we prefer to short stocks and not the indexes and we still think that’s the case here. But we also think it’s likely that the major indexes are in the process of topping. Here’s a look at NASDAQ via a logarithmic chart with its corresponding monthly MACD in the bottom panel. If you were just shown the MACD we think you’d agree with us and say you’d rather not be a buyer here.
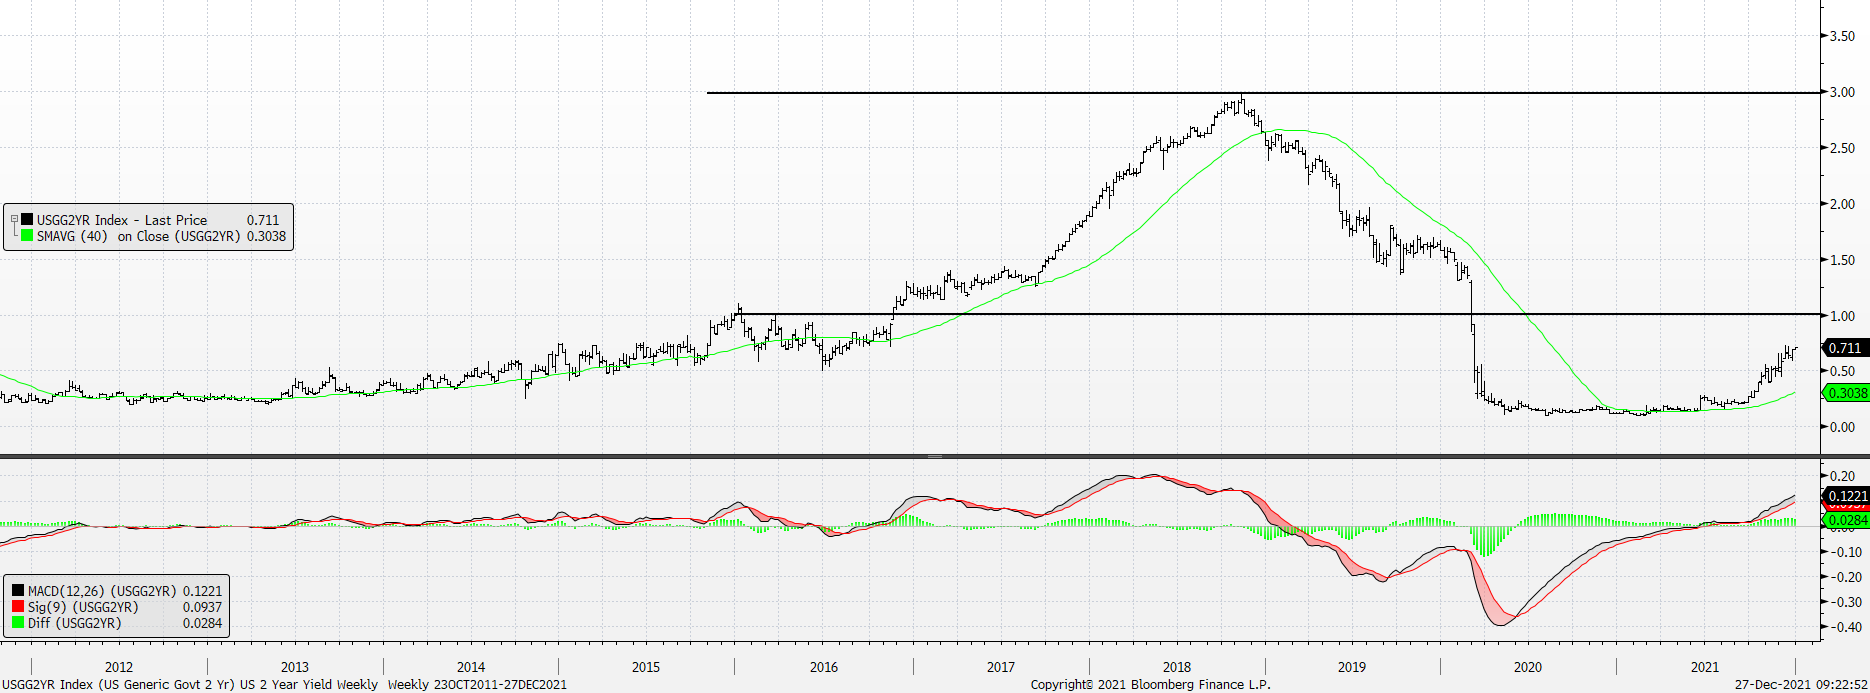
We’re still expecting the US 2 Year Yield to get to 1%.
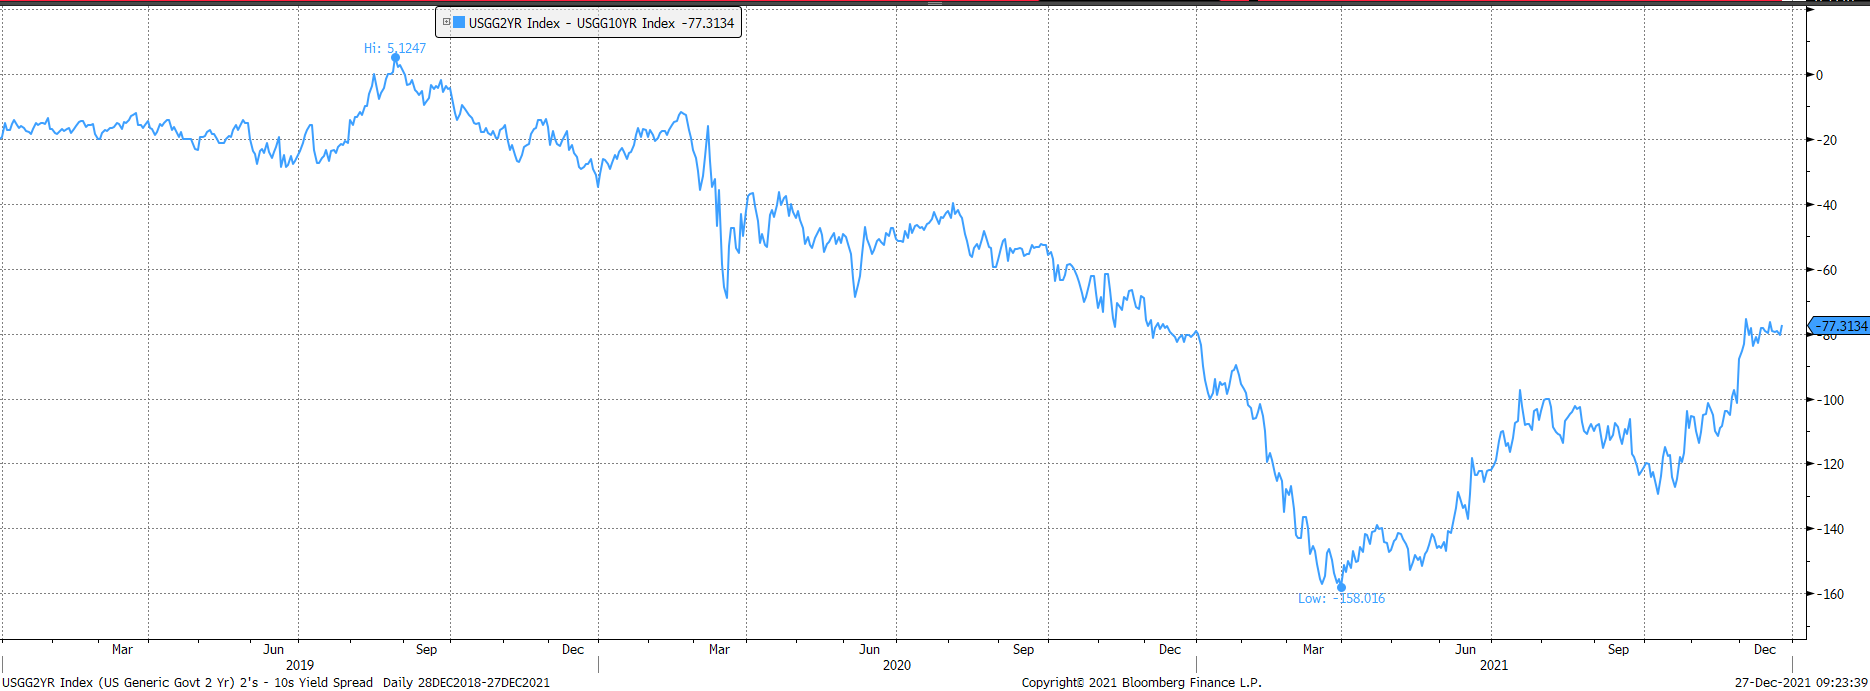
2s – 10s YC looks higher / flatter to us.
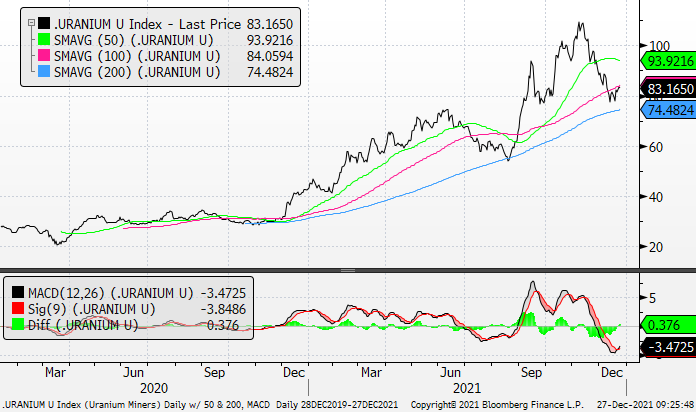
Our Uranium Stock Index is on support and oversold. We’re expecting it to rally.