Source: Google Images
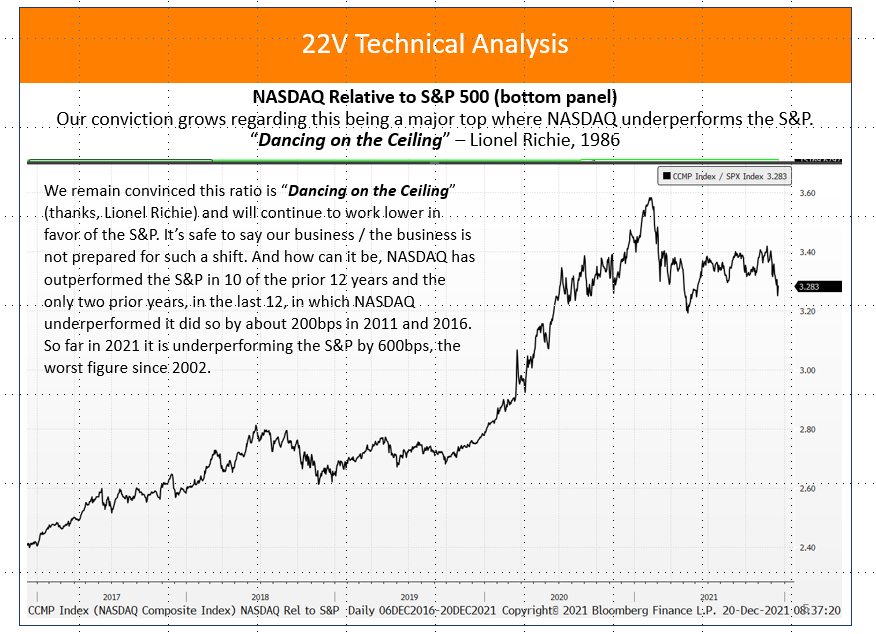
We’re sure you know the game and we’re sure you’ll get the market analogy immediately.
It’s been for some time that the market’s internals have been in a deteriorating state. Yet, during the to date internal deterioration the indexes – and many investors, too – have been blissfully unconcerned. But the market’s structure contines to become more unstable.
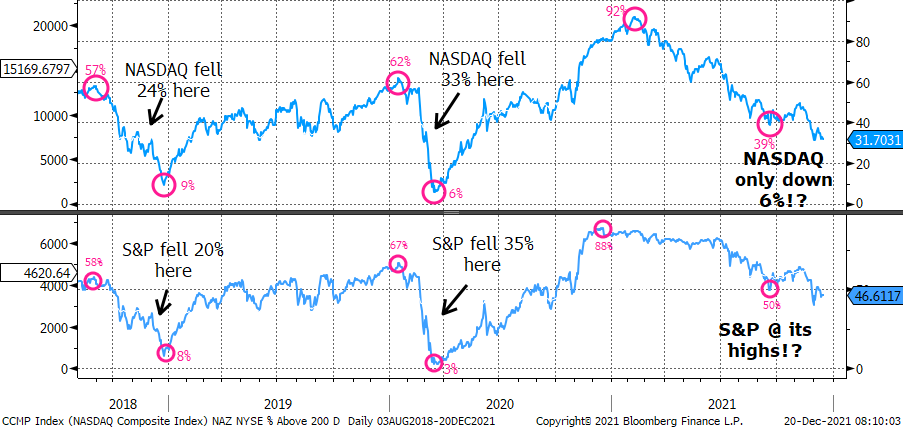
For example, the % of stocks above their 200-day moving averages for NASDAQ is at the 32% level, in line with recent low figures, but notably beneath the lowest level from September. The same is true for NYSE figures as it remains under its September low. The chart below shows that the % of stocks above their 200-day moving averages for NASDAQ, which peaked in February 2021, is down 60%(!) while NASDAQ itself is only off 6% from its highs. Too, the NYSE % which peaked in December 2020 (!) is virtully at its highs! Look no further than the Big 7 – which are 26% of the S&P and 40% of NASDAQ – to explain this bizaare situation. You can guess, based on our title and the image above, that we believe that the unstable market structure will topple.
In addition, and we’ve shown this a lot in our Webinar Chart Packets, NYSE and NASDAQ New Highs are endangered species’. You might still be shocked to learn that NYSE NHs peaked in May and NASDAQ NHs peaked in February! It’s our truism, but it’s still a truism, that nobody makes money on the long side when the number of NHs slides and investors outright lose money when NLs > NHs. Lastly when it comes to market indicators, NYSE Cumulative Breadth [the daily difference, accumulated over time, of Advancing Stocks less Declining Stocks] is thisclose to breaking down and it’s safe to say that given where stocks are slated to open support for Cumulative Breadth won’t hold (chart below).
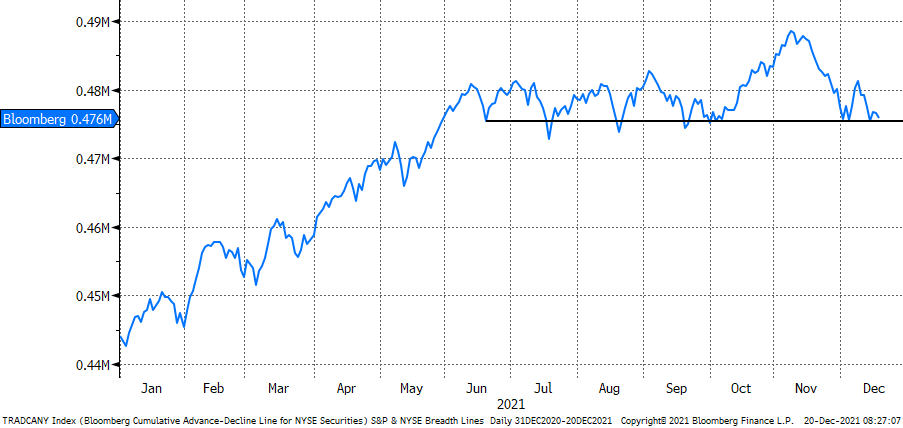
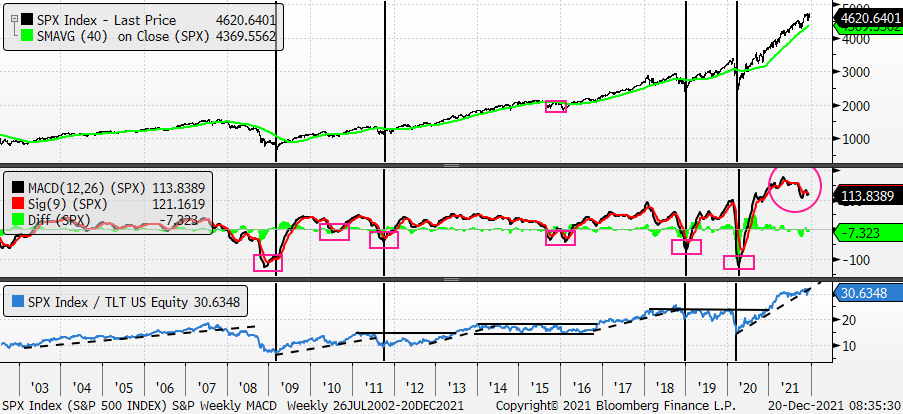
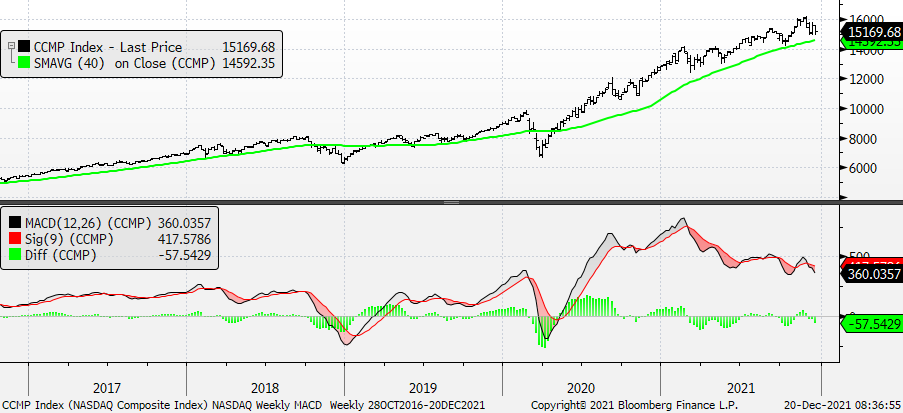
We continue to look for the S&P and NASDAQ to get to their September lows. Perhaps it’s too early to try to game, gauge or guess what would follow thereafter. But we all should not be surprised when the market continues to be difficult into the early part of 2022, at least, as momentum for both major indexes is still weakening and is not close to being oversold (charts follow).