
Our entire repository of COVID charts is HERE.
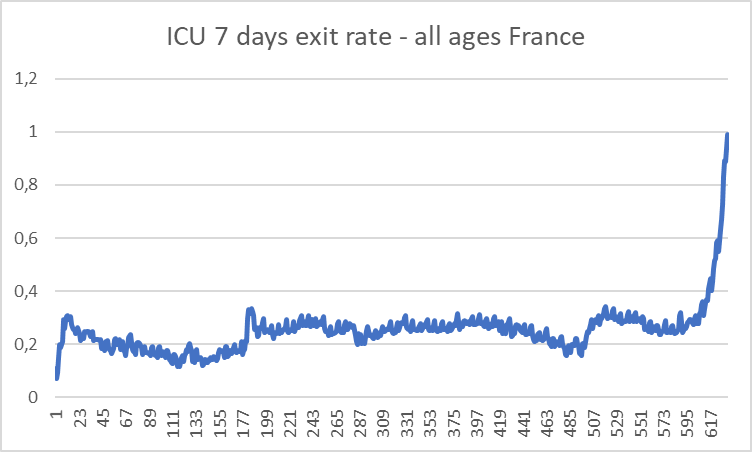
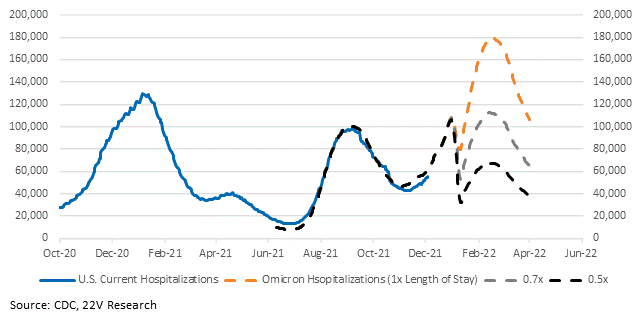
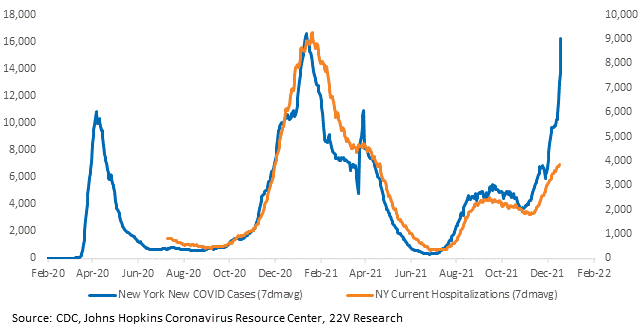
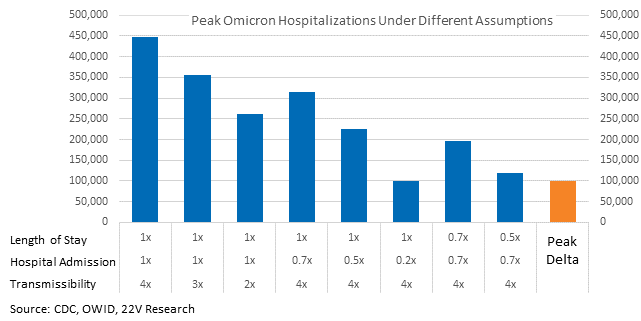
Francois Balloux, director of the University College London Genetics Institute, analyzed Denmark’s Omicron hospitalization data and highlighted (in this thread) that the Omicron hospital admission rate is ~60% less than Delta. Assuming 4x transmissibility, 0.4x hospital admissions rate, and same length of stay as Delta, Omicron hospitalizations would peak around 180k in the US. It’s worth noting that the length of stay has a huge effect. If the average stay falls from ~10 days (Delta average) to 7 days, hospitalizations would peak around 115k. ICU data from France indicates shorter hospital stays. FYI, the drops in hospitalizations you see in the charts occur as Omicron takes over and Delta hospitalizations are worked through while Omicron hospitalizations are built up slower.

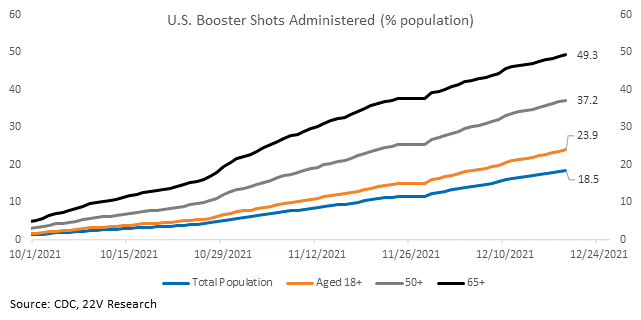
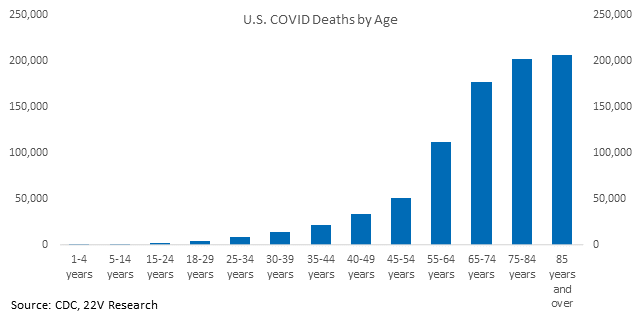
Moderna said a third dose of its vaccine increases antibodies 37-fold against omicron. Boosters help, but it’s a little late. Only 19% of the population has received a booster. Case growth is higher and it’s already accelerating in high vax states like New York. On the bright side, more at risk people are boosted. Given death demographics, boosters should provide some relief in severity metrics.
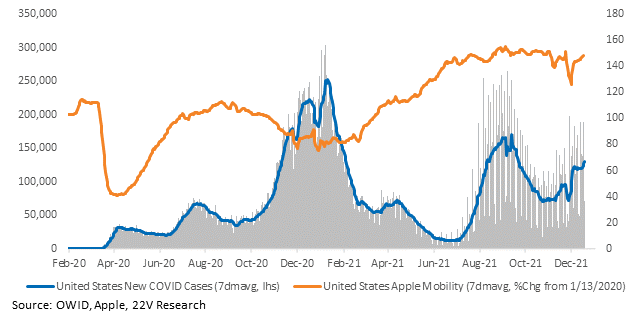
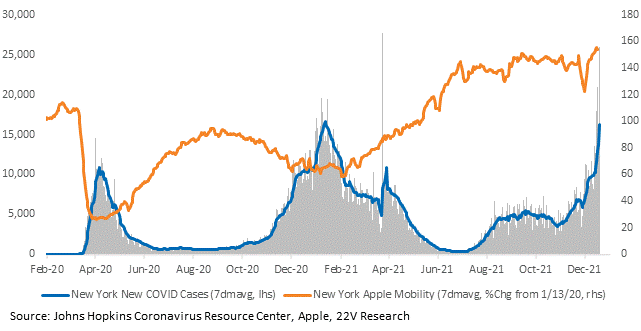
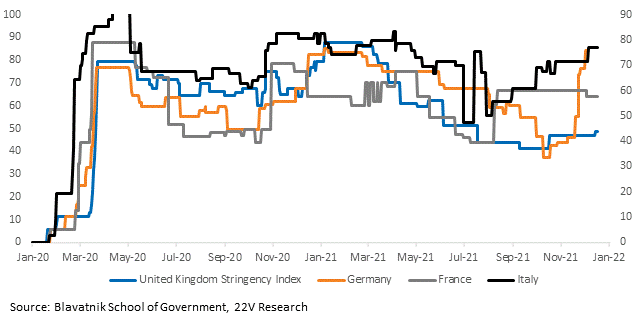
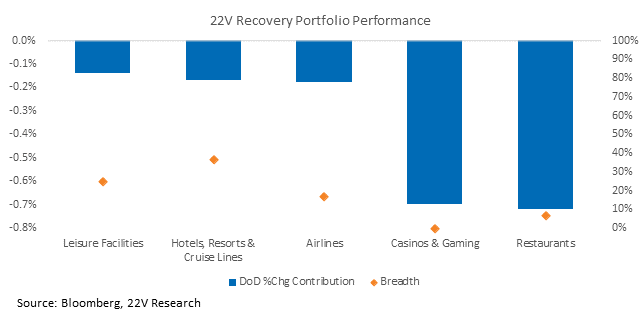
Lockdowns in Europe are contributing to market pessimism. We can measure restrictions with Oxford’s stringency indices, which show a general increase in restrictions across Europe towards early 2021 levels. Our Recovery Portfolio is down another -2% today. Over the weekend, Fauci said lockdowns probably won’t be necessary but warned hospitals will come under strain.
The UK is a good comp and we expect the market to react to UK data. We need to see a similar result as from the Delta wave, when cases rolled over without a substantial increase in hospitalizations and deaths. We are a couple weeks away from Omicron hospitalization and death data because they lag case growth. Low volatility and Defensives, which have had outlier relative performance over the past month, will come under relative pressure as/if worst case scenarios are taken off the table.
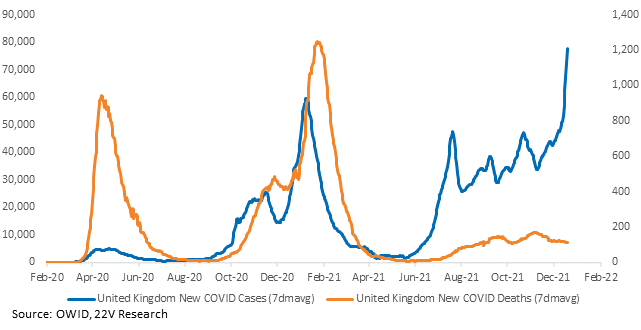
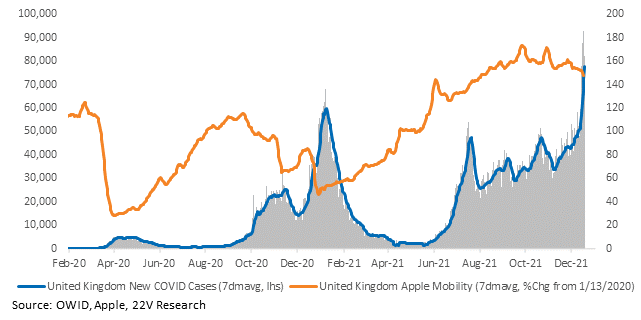
Uncertainty will remain elevated, for now, because we lack clean enough data to narrow the incredibly wide estimations of Omicron hospitalizations. This is why Defenses are outperforming, the term premium has dropped, 10yr yields have fallen, and our Recovery Portfolio has underperformed.
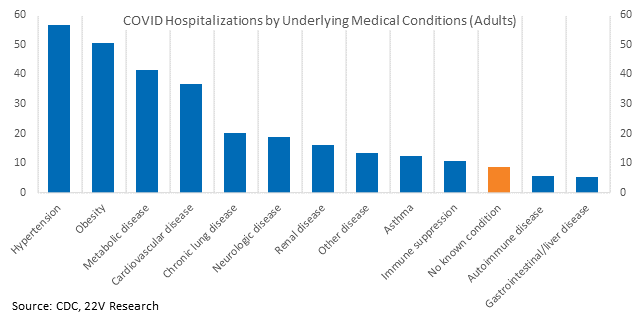
Don’t forget about new therapeutics. Per Eric Topol’s substack, “Until now in the pandemic, our prevention and early treatment of Covid has relied upon our immune system: vaccines and monoclonal antibodies. Our immune response has been substantially evaded by Omicron. Along comes Paxlovid, a pill that could be readily administered which does not rely on our immune response. Omicron doesn’t evade this drug’s effect.” Paxlovid is nearly 90% protective against hospitalization and deaths. The FDA may authorize the drug by year-end. Several health experts think the immediate authorization will only be for people at high risk, but that is still meaningful considering most people who are hospitalized have comorbidities (CDC list here). The only sticking point may be supply; Pfizer can treat 180k people this year, but 21 million or more by the end of June 2022.
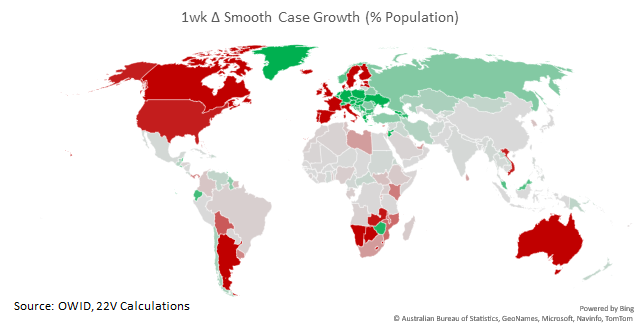
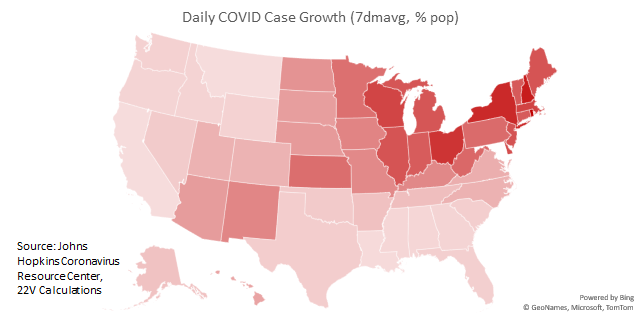
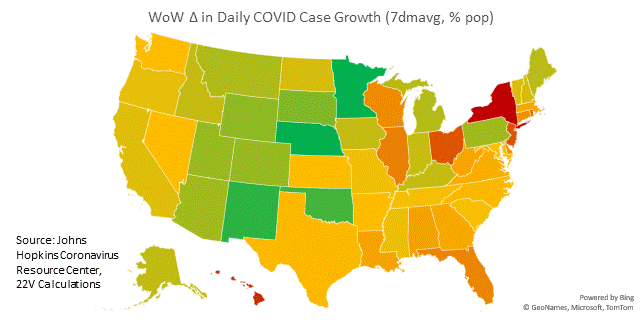
Globally, case growth is higher across the Americas, Developed Europe, Africa, and Australia. Within the United States, case growth is worst in the Northeast and Midwest. Growth rates are increasing in the South.
Charts for every state and country we have data for are HERE.

