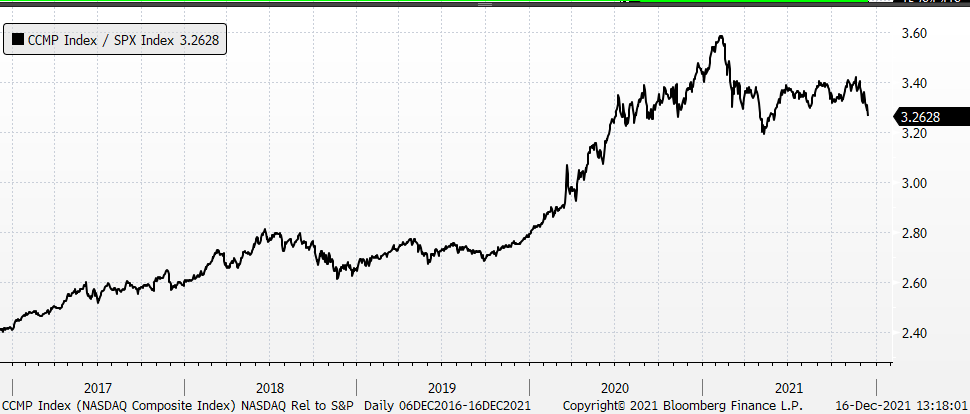
The chart here shows the relative ratio of NASDAQ / S&P 500. We remain convinced that this ratio is “Dancing on the Ceiling” (thanks, Lionel Richie) and will continue to work lower in favor of the S&P. We believe it’s safe to say that our business / the business is not prepared for such a shift. And how can they be, NASDAQ has outperformed the S&P in 10 of the prior 12 years and the only two prior years, in the last 12, in which NASDAQ underperformed it did so by about 200bps in 2011 and 2016. So far in 2021 it is underperforming the S&P by 600bps, the worst figure since 2002.