
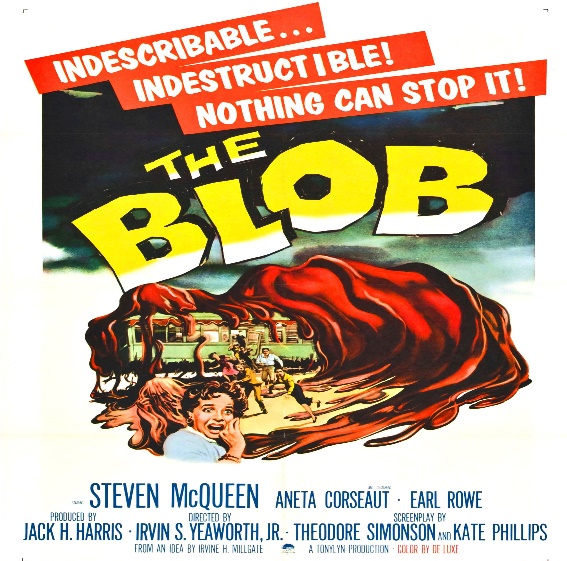
The Blob (picture source: Google Images) is a sci-fi classic from the late 1950s. The movie starred Steve McQueen and Aneta Corseaut as two teenagers who try to protect their town from an alien life form that absorbs everything it touches while growing bigger and redder and more aggressive.
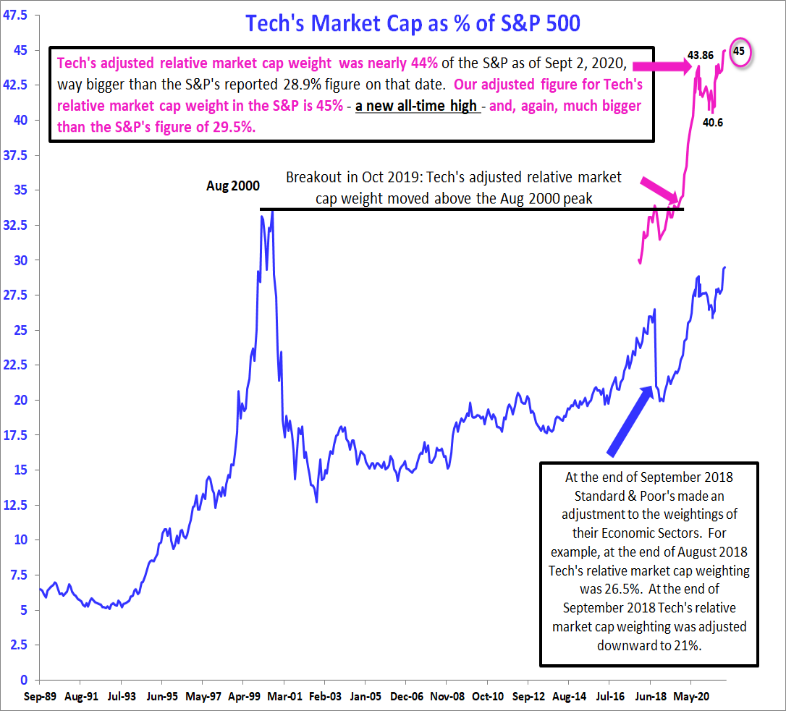
Source: 22V Research
We thought about the movie and how The Blob could also very well apply to Tech’s position in the market. The Blob-like comparisons are many. For example:
Year | 22V’s Tech Adjusted Market Cap % | Year / Year % Change |
2017 | 30% | N/A |
2018 | 32% | +6.7% |
2019 | 35% | +9.4% |
2020 | 42% | +20% (+40% in 3 years) |
2021 | 45% (Dec 10, 2021) | +7% (+50% in 4 years) |
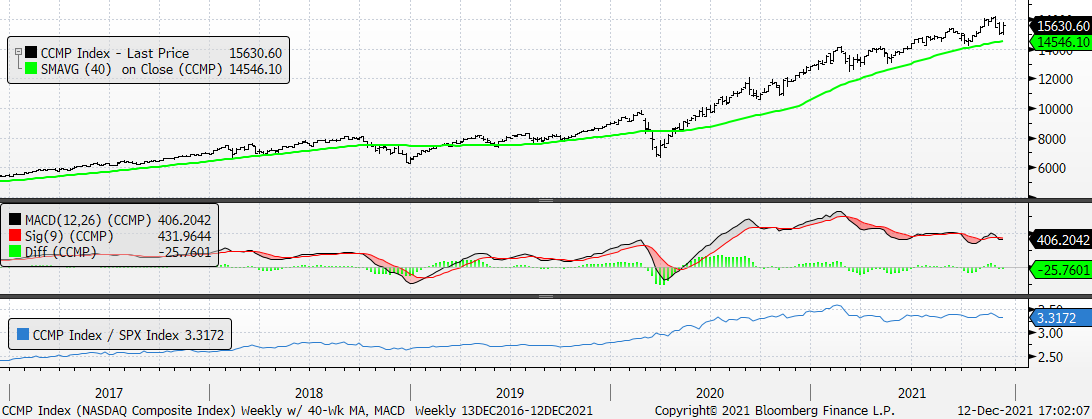
With the above inputs it’s certainly understandable that Tech – top panel – and Tech Relative to the S&P – bottom panel – look unassailable.
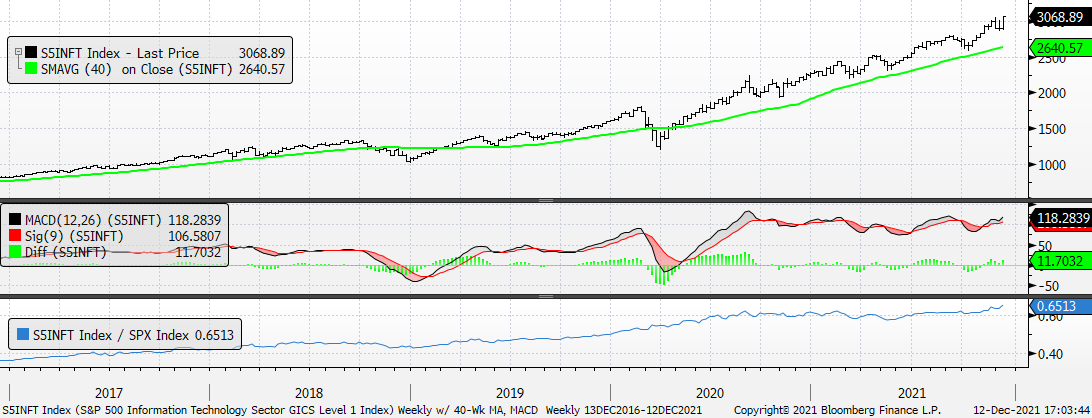
In contrast, NASDAQ is different than Tech in that (a) Momentum, via the weekly MACD in the middle panel, is well under its early 2021 high while Tech’s momentum, in the middle panel above, looks like a new high is in the offing, and (c) NASDAQ Relative to the S&P appears to be topping.
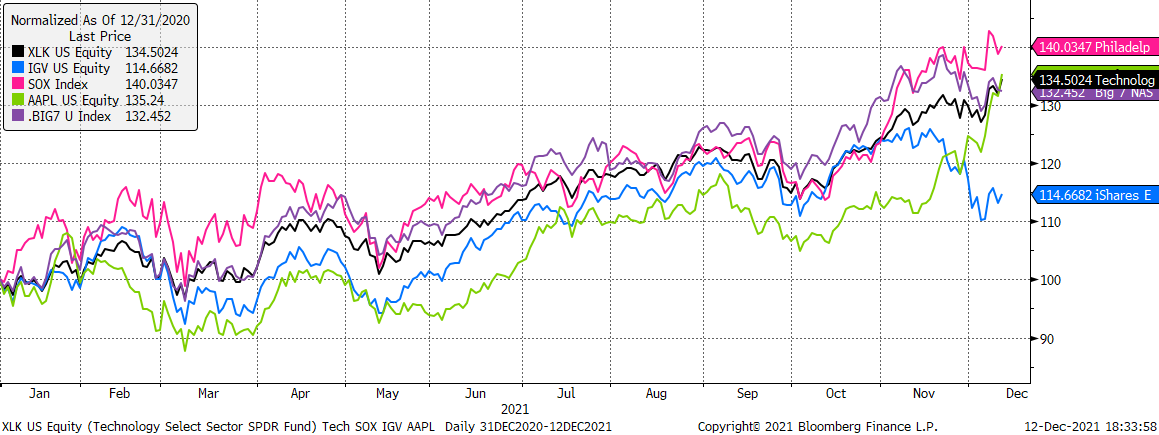
Here’s how five Tech Indexes look on a year-to-date basis:
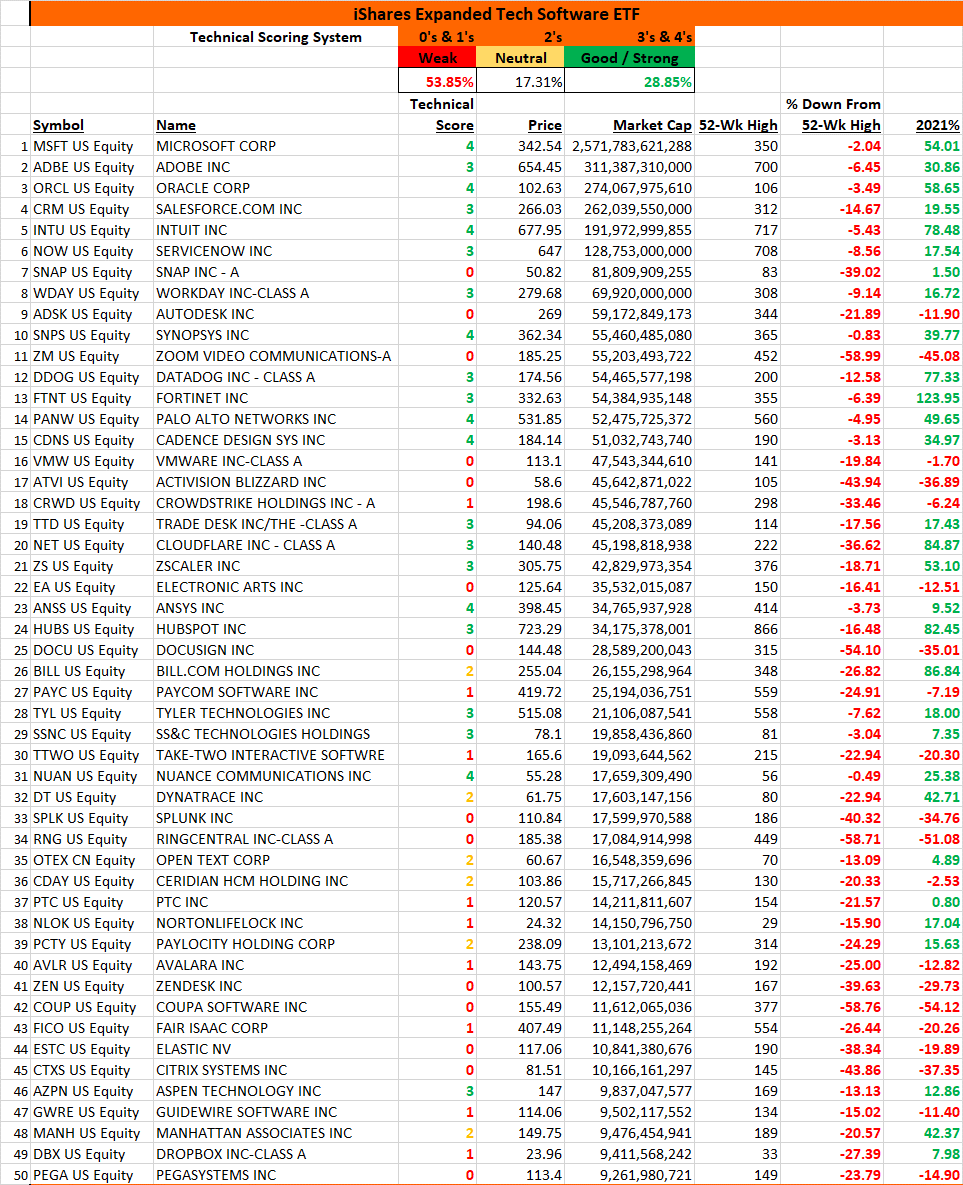
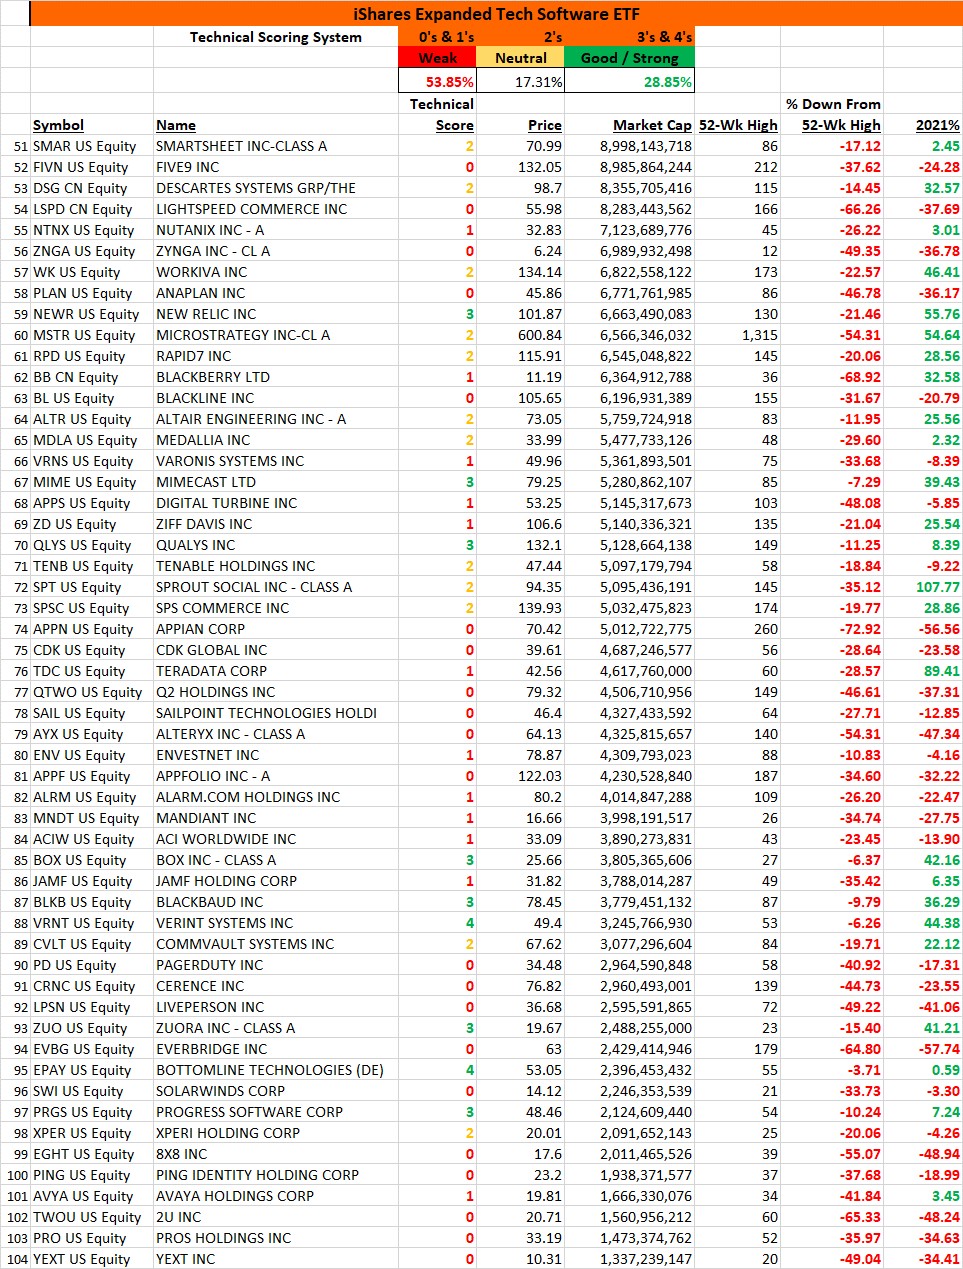
SOX+40%, AAPL +35%, XLK +34.5%, BIG 7 +32%, and IGV +14.7%. It’s obvious that the IGV is the weakest of the indexes in the chart while the SOX is in the lead. Incidentally, MSFT is 50% of the market cap of the entire IGV. Please see below for our Technical Scoring for the components of the IGV. With only 29% of the stocks showing Good / Strong Scores it’s safe to say Software is in a bear market.
We’ve been asked, “When will Tech correct?” We don’t think that’s the right way to think about it. Rather, we believe it’s more appropriate to say, “Tech better not correct sharply.” Remember what happened to the market after Tech peaked between 33% – 34% of the S&P in the year 2000? Today Tech is more than 30% bigger than it was at that time…yeah, “Tech better not correct sharply.”
At the end of The Blob, the townsfolk discover that the creature is vulnerable to cold temperatures. They arm themselves (remember it was the late 1950s) with CO2 fire extinguishers and freeze the organism. The Air Force is called in and they transport The Blob to the Arctic where it will stay on ice and inert.
We continue to think it is unlikely Jay and the Federales use their own CO2 fire extinguishers and raise rates aggressively to freeze stocks selling at high P/S multiples. But we did find it a bit curious yesterday to see Mohamed El-Erian pointedly criticize Jam Master Jay and the Fed on CBS’s “Face the Nation.” El-Erian said, “The characterization of inflation as transitory — it’s probably the worst inflation call in the history of the Federal Reserve.” He clearly couched his comment by not saying, “worst call in the history of the Federal Reserve.” He knew exactly what he was doing.
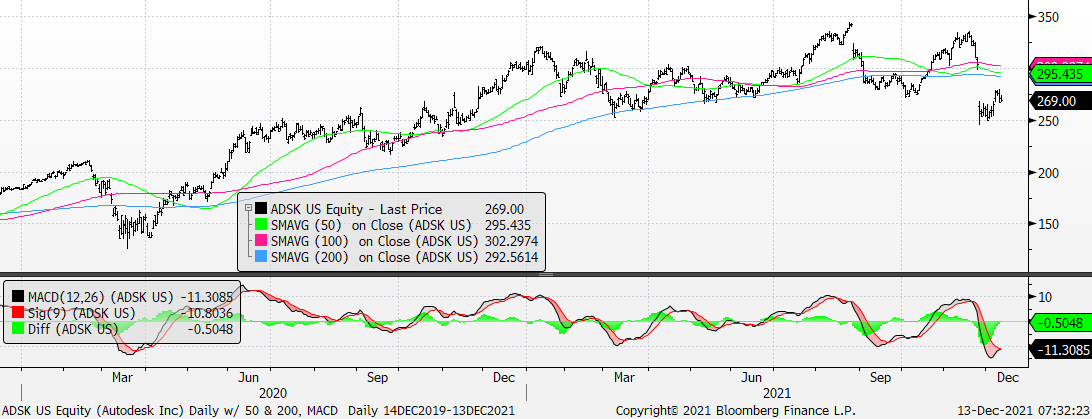
Autodesk (ADSK) – Technical Score = 0; Sell rallies
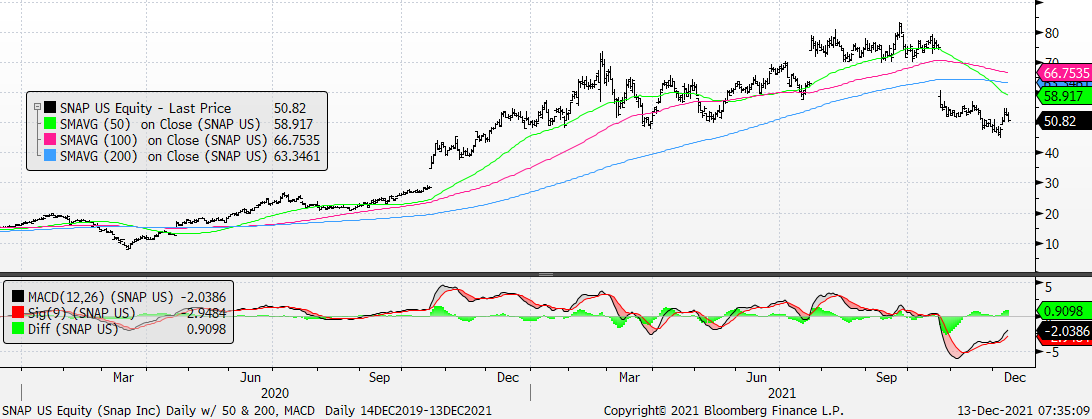
Snap (SNAP) – Technical Score = 0; Sell rallies
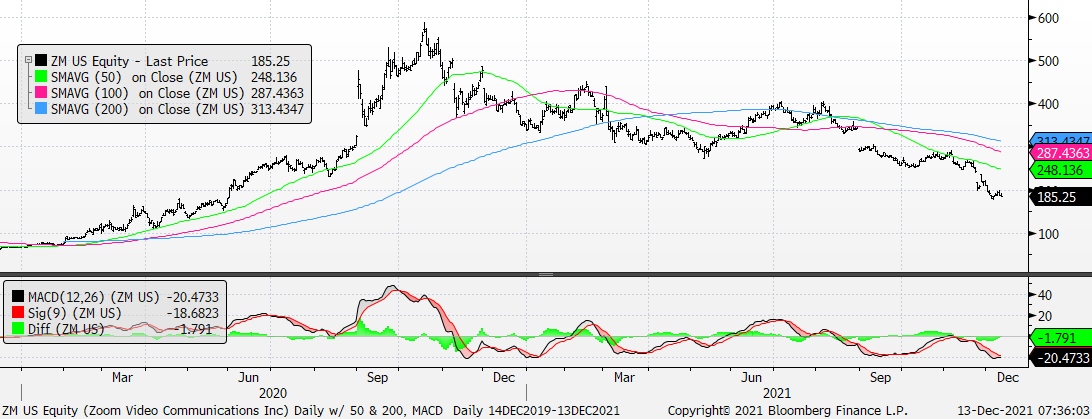
Zoom Video (ZM) – Technical Score = 0
Source: 22V Research
Source: 22V Research

