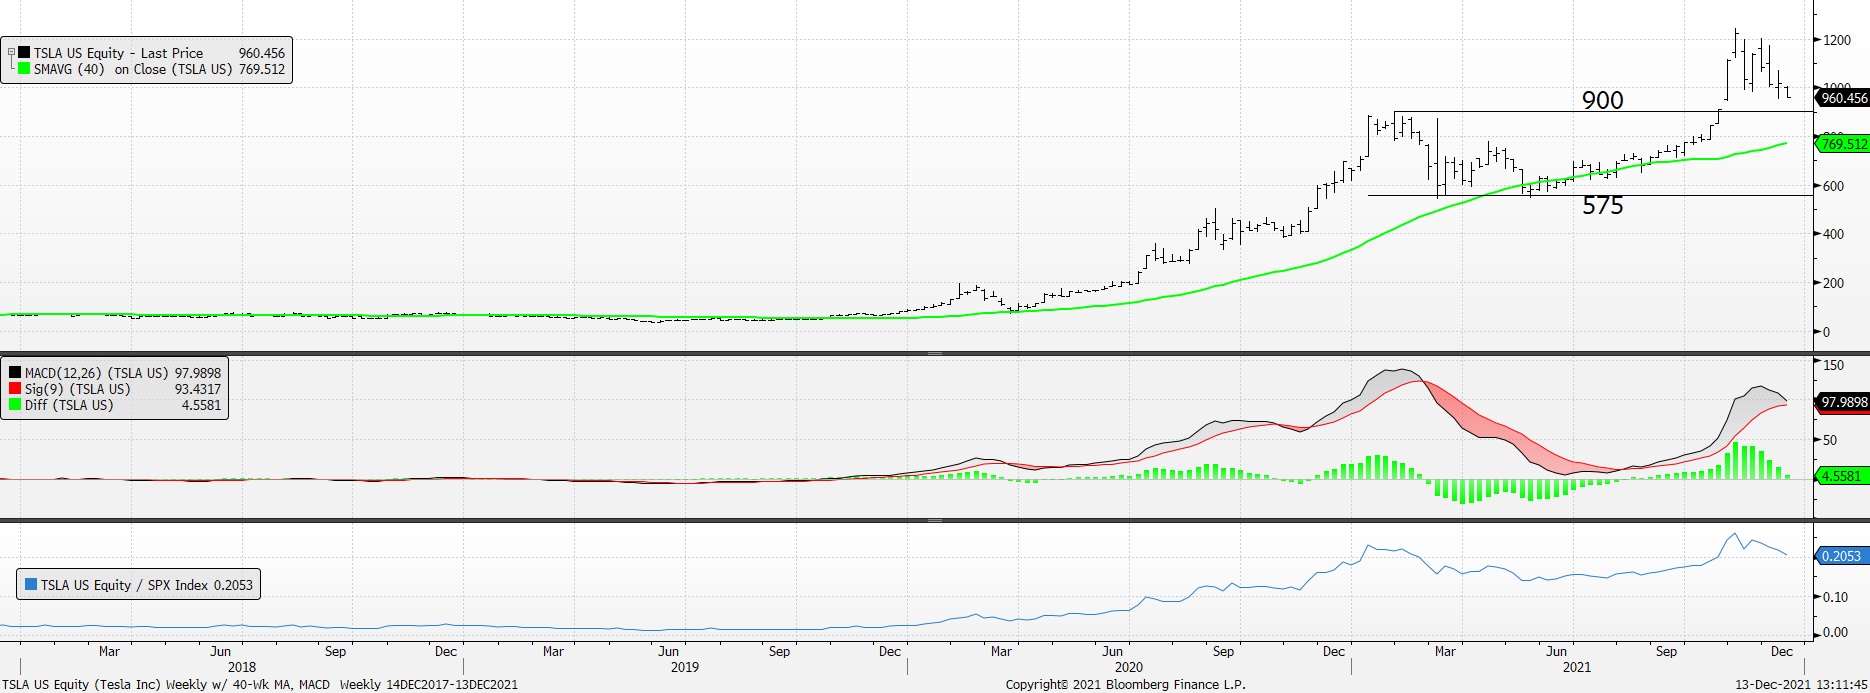
We had the good fortune to be in contact with the inventor of the “Magazine Cover Indicator,” Paul Macrae Montgomery, many years ago. Mr. Montgomery, who was a proper gentleman (he used the term “courting” to analogize him dating his future wife with a market idea), died in 2014 but his indicator idea lives on. It’s hard not to think of him and the “Magazine Cover Indicator” today what with Elon Musk making the grade as the TIME Person of the Year.
Mr. Montgomery described his “Magazine Cover Indicator” as follows:
(1) The publication must be mainstream (i.e., TIME and not The Economist; however, The Economist’s history as a contrary indicator is pretty good).
(2) The subject on the cover of the mainstream publication lends itself to a well-known idea that just might be reaching / might have reached its apex.
(3) The subject on the cover should have enjoyed big price gains leading into the publication (or big price declines, i.e., August 13, 1979 – Newsweek had on its cover, “The Death of Equities: How Inflation is Destroying the Stock Market”; the bottom in the market had occurred in October 1974 and CPI Year / Year figures peaked in March 1980).
(4) The trend in force at the time of publication was thought to continue for another six months before ending.
Musk or, more specifically, Tesla (Technical Score = 3) fits the bill on the first three inputs. He / TSLA are on the cover of a mainstream magazine, he/TSLA/electric cars are certainly a well-known idea that might be reaching / might have reached – at least – some near-term apex. This seems especially so given Build Back Better plan of up to $12,500 tax incentives to boost the adoption of electric vehicles (contact Kim Wallace 22V’s policy guru for details – [email protected]). Also, TSLA and big price gains have been synonymous.
The fourth component – The trend in force at the time of publication was thought to continue for another six months before ending – might have to be sped up for this era as Mr. Montgomery did not have to solve for algo trading, r/wallstreetbets, or the ubiquity of ETFs.
Using the 900 level as resistance from Jan 2021 and 575 as support / bottom of the range from May 2021 we estimated a target of 1225 for TSLA (900 – 575 = 325; 900 + 325 = 1225). It peaked at 1243 on November 4 which is (a) close enough for government work and (b) pretty lucky. TSLA is currently retreating to the 900 level which, of course, was former resistance or its last breakout level. But the 28% pullback, for TSLA, to 900 within its uptrend is not what Mr. Montgomery had in mind when he did his study since he was referring to an important trend change and that would mean a proper bear market decline for the stock.
TSLA’s week momentum indicator (MACD, middle panel) did not confirm the late October 2021 breakout to new highs – this is a negative divergence – and it is only now cresting from an overbought reading. The last time TSLA’s MACD peaked and rolled in early 2021 the stock declined 40%. Too, it appears to have put in a double-top vs. the S&P 500 (bottom panel). While our daily momentum work is in negative territory and our weekly momentum work is cresting / rolling, monthly momentum is still pinned at all-time highs. TSLA’s 200-day moving average is currently at 770. To see the stock work below there wouldn’t be so extraordinary. It might be worth mentioning again that the bottom of its former range was 575. Only a handful of fundamental analysts on the Street have a target price that low.