
SUMMARY: Yesterday’s market internals were consistent with fears of a stronger than expected CPI reading today and the resulting upside to Fed rate hike expectations (from an already elevated level), which explains the underperformance of earnings turbulence, and growth (things negatively correlated to an increase in the cost of capital). We don’t have a strong view on CPI but are firmly with consensus that CPI has upside risk. That noted, assuming the CPI number is not outlier bad, most of the concerns around inflation and the Fed reaction function are priced in (2yr yields are extreme overbought). The Fed is going to be data dependent and flexible going forward. Forecasting how the curve will look and how much they need to tighten to slow growth will be difficult. In the meantime, financial conditions remain easy and economic growth firm (next 3-6 months).
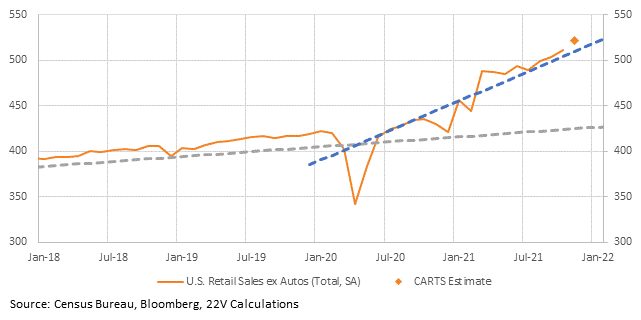
The Chicago Fed releases weekly retail sales based on high frequency data (called CARTS), which is rolled up into an estimate of retail sales ex autos. The current estimate for the December reading is at +1.9%. Consensus estimates are for +0.9%. CARTS has been a consistently better estimate of retail sales.

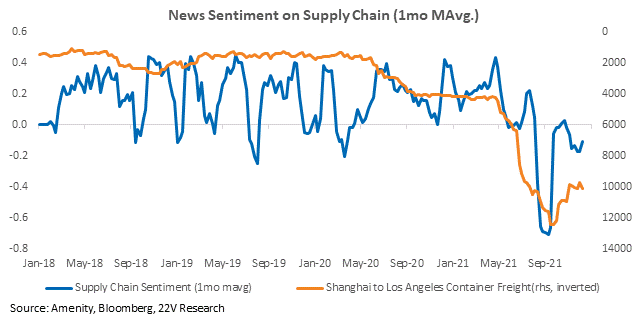
Fortunately, some of the recent negativity on supply chain sentiment has started to reverse again. Improved supply chain sentiment has coincided with lower freight rates. Since most economist are assuming easing of supply chains next year, it is important that it happens. Especially given the ongoing demand boom in goods (see retail sales estimate above). Otherwise headline CPI could be stuck at relatively high levels.
Correlations are low and volatility is back near pre-GFC levels. That backdrop will continue to favor micro trends over the coming year. To help with industry group selection, we have built a quick industry heat map showing
The idea is to screen quickly for industries that have high potential for micro trends (high correlation, larger macro influence), and which ones have the most attractive fundamental backdrops (high sentiment, higher ERPs). It is also a quick way of looking for industries that offer higher stock specific potential. Details in the report below…
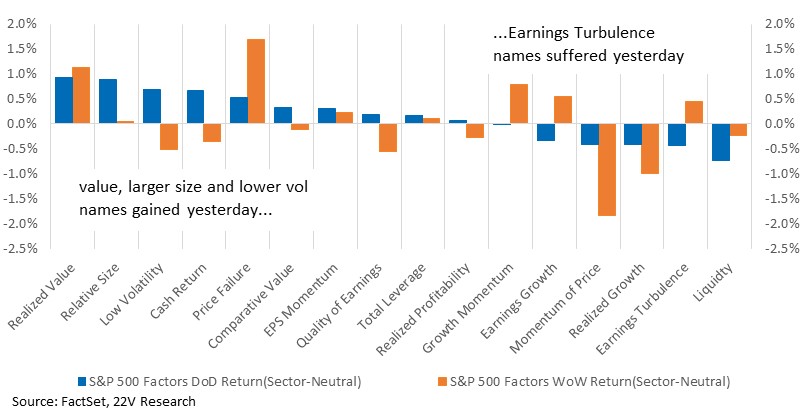
MARKET VIEWS: After the sharp rebound Mon-Wed, risk assets moved lower yesterday as investors started to worry about a higher than expected CPI reading today. The official print is expected to be 6.8% YoY number and some investors have talked about 7.0% YoY or higher. We don’t have a strong view on this other than the bias is for a strong CPI. We would add that yesterday’s internal market action was consistent with some combination of stronger than expected CPI and the resulting upside to Fed rate hike expectations (from an already elevated level). To put simply, yesterday was an increase in the cost of capital trade day as volatility, earnings turbulence, and growth suffered.
Assuming the CPI number is not outlier bad, we think most of the concerns around CPI and the Fed reaction function are priced in. The Fed is going to be data dependent and flexible going forward. So forecasting how exactly the curve will look and how much they need to tighten to slow growth will be really hard. In the meantime, financial conditions will still be easy and economic growth firm (next 3-6 months). On the consumer spending side, data continues to be strong. The Chicago Fed releases weekly retail sales based on high frequency data (called CARTS), which is rolled up into an estimate of retail sales ex autos. The current estimate for the December reading is at +1.9%. Consensus estimates are for +0.9%. CARTS has been a consistently better estimate of retail sales.
The continued demand boom in goods is keeping the supply chain tight. Fortunately, some of the recent negativity on supply chain sentiment has started to reverse. Improved supply chain sentiment has coincided with lower freight rates. Since most economist are assuming easing of supply chains next year, it is really important that it happens. Otherwise headline CPI could be stuck at relatively high levels.
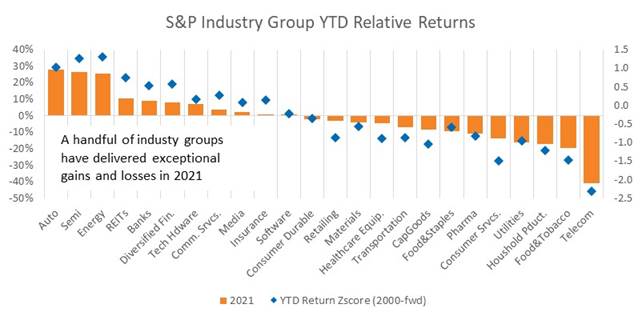
SCREENING FOR MICRO THEMES: Market volatility and industry group mean reversions made screening for micro themes exceptionally important in 2021. At the industry group level there have been a handful of unusually strong performers (Autos, Semis, Energy; all Cyclicals) and a group of outlier underperformers (Telecom, Food, Utilities, Consumer Services; mostly Defensives).
Over the course of the year we have remarked on the unusual level of mean reversion within the market. At the industry group level, a simple strategy of going long the worst performing industries from the previous month and shorting the best performers has consistent positive returns. This is clearly a high turnover strategy, but could be deployed using ETFs and delivered a dollar neutral return of 14.6% YTD. Not bad for a two rule portfolio.
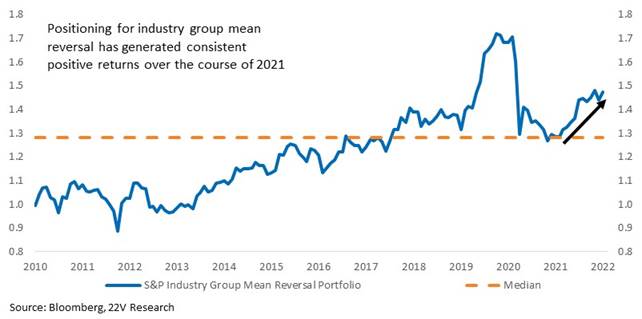
But as the first chart illustrates, investors were richly rewarded for building and sticking to positions in groups like Autos, Semis and Energy. With the Fed shifting into tightening mode, inflation and growth well above their pre-pandemic trends, the playbook for most of the post-GFC period is being torn up. Correlations are low and volatility is back near pre-GFC levels. That backdrop will continue to favor micro trends over the coming year. To help with industry group selection, we have built a quick industry heat map showing
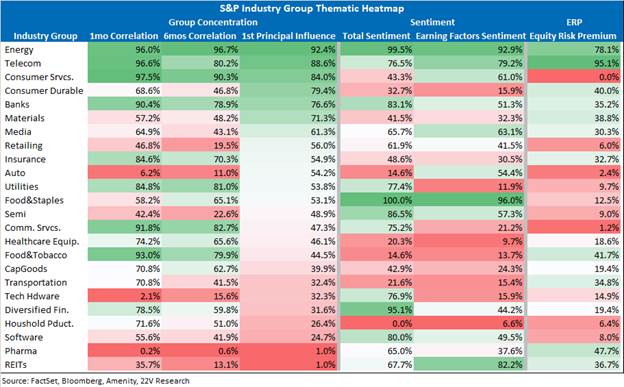
The idea of this heat map is to screen quickly for industries that have high/low potential for micro trends (high correlation, larger macro influence), and which ones have the most attractive fundamental backdrops (high sentiment, higher ERPs). It is also a quick way of looking for industries that offer higher stock specific potential. REITS, Pharma, Software tend to have lower correlations (more potential for stock specific deviations within groups). RETS in particular also have strong sentiment scores though their ERPs are less attractive.
*We make extensive use of the Amenity natural language processing tool to analyze management sentiment toward more than 100 topics discussed during quarterly earnings calls.

