
GOAT – Greatest of All Time

Source: Google Images
Ali, Gretzky, Ruth, Serena, Nunes, Secretariat, Phelps, Savickas, and Druckenmiller – GOATS all!
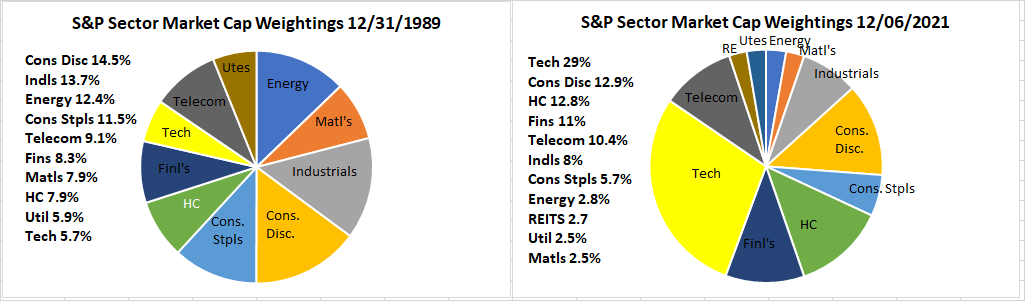
What follows is not an apples-to-apples comparison because in September 2018 Standard & Poor’s, in their infinite wisdom, changed the weightings in some of their Economic Sectors. S&P took REITS out of Financials and created a REIT Sector, and they took companies out of the Cons. Disc. and Tech Sectors and shifted them into the Communications Services Sector. Still, it’s a decent snapshot of the S&P’s Economic Sectors in December 1989 and today.
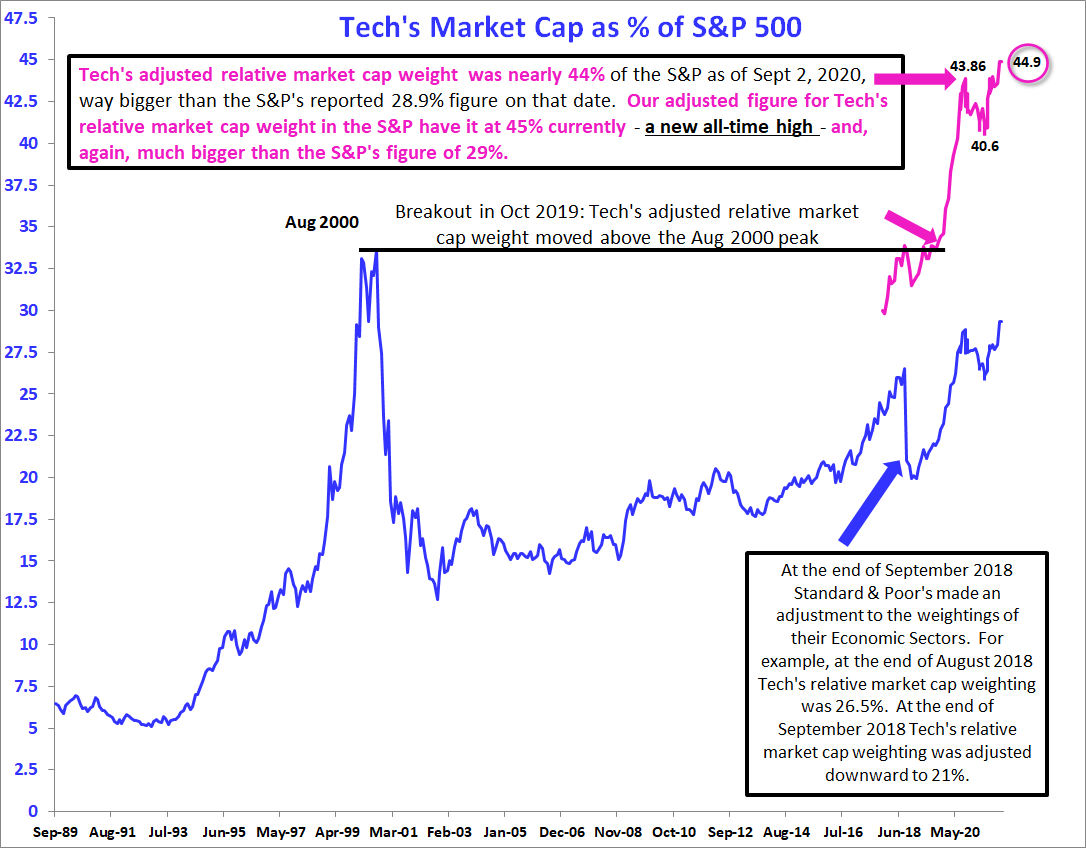
The pie chart to the left shows relative market cap weightings for the then 10 S&P Economic Sectors. Tech was a flyweight in 1989 with a less than 6% weighting in the index. The version to the right shows the now 11 Economic Sectors and, obviously, Tech is the biggest sector with a 29% weighting. However, our adjusted figure for Tech – i.e.; when we put everything back into Tech that S&P took out – shows the Sector has a 45% weighting which makes it a veritable superheavyweight (see chart further below).
Source: 22V Research
What might be of further interest, again on an apples-to-apples basis, is knowing that over more than three decades there are only three Economic Sectors that are bigger today on a relative market cap basis within the S&P 500 than they were in December 1989: Financials from 8.3% to 10.9% (or 13.6% if we add back the REIT Sector), Health Care from 7.9% to 12.8%, and Tech from 5.7% to 29% (45%). Suffice it to say that we believe our 45% weighting for Tech is more accurate and representative of Tech’s actual size in the index if only for the fact that the combined market caps of the biggest six tech (we’ including AMZN) stocks – Apple, Microsoft, Alphabet, Amazon, Meta Platforms, and NVIDIA – are, by themselves, more than 24% of the weight in the S&P. Riddle us this, S&P, “If these six stocks are more than 24% of the S&P how can the entire Tech Sector be just 29% of the index?”
Over 32 years Tech has moved from flyweight (< 6% of the S&P) to superheavyweight via our adjusted weighting (45% of the S&P) and belongs in the GOAT category. It’s often said in championship fights that the challenger must knock the champion out to claim the title. The same might be said here in that unless the Big 6 come under collective pressure there are easier battles to fight.
Source: 22V Research

