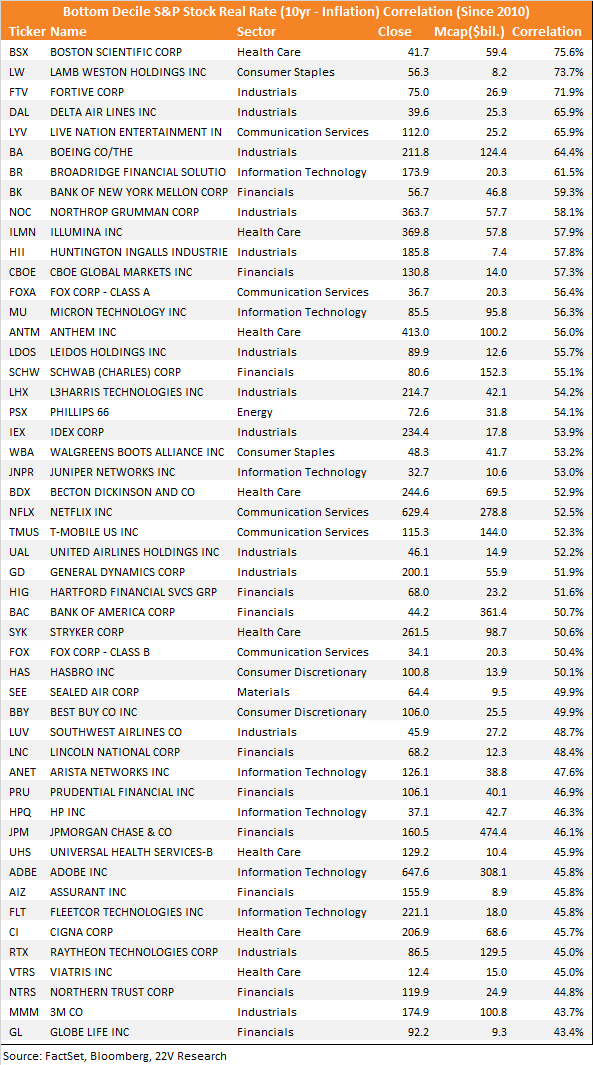
SUMMARY: For much of the post-GFC period negative or near zero implied real yields, combined with persistently slow growth and aggressively supportive central bank policy, helped support risk assets. For context, from 2000 through the start of the GFC, unprofitable tech underperformed the broad market (S&P 1500) by 11% annually. From 2019 forward, it outperformed by 11% annually. Though real yields remain deeply negative, the relationship with unprofitable tech has reversed in 2H21.
Inflation expectations have moved higher this year and are well above their post-GFC, pre-pandemic level. Fed policy has shifted over the past several months as inflation has increased further and for longer than economists had hoped. That, along with Omicron concerns have helped push inflation expectations lower. More contained inflation plus firm growth does not guarantee higher real yields, but as Gerard noted last week “some tightening of overall financial conditions, led by higher yields or lower risk asset prices, would probably be judged appropriate.”
To position for a shifting real rates backdrop, we constructed a portfolio of the S&P stocks with the highest correlations to changes in real yields. So far, the index, on a long-short basis, has closely followed changes in implied real yields. Recently, the long end has outperformed the short, suggesting investors are starting to either position for higher real yields or, at least, are shying away from the stocks most levered to falling real yields.

At the end of this report we list the stocks in both the long and short implied real rates portfolio. Regardless of your view on real yields moving forward, their importance as a macro force is likely to be higher over the coming quarters as monetary policy makers again try to move off the zero lower bound.
REAL RATES POSITIONING:
For much of the post-GFC period negative or near zero implied real yields, combined with persistently slow growth and aggressively supportive central bank policy, helped support risk assets. Over the past few years (2019-forward) unprofitable companies, tech specifically, dramatically outperformed as real yields collapsed to new lows. For context, from 2000 through the start of the GFC, unprofitable tech underperformed the broad market (S&P 1500) by 11% annually. From 2019 forward, it outperformed by 11% annually. Though real yields remain deeply negative, the relationship with unprofitable tech has reversed in 2H21.
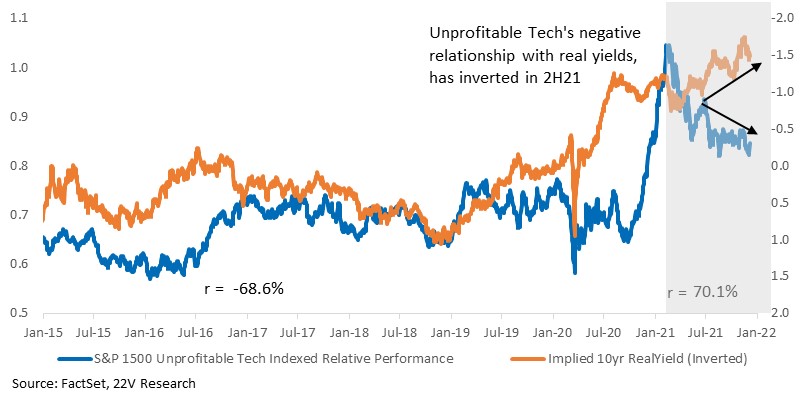
Inflation expectations have moved higher this year and are well above their post-GFC, pre-pandemic level. Fed policy has shifted over the past several months as inflation has increased further and for longer than economists had hoped. That, along with Omicron concerns, have helped push inflation expectations lower. More contained inflation plus firm growth does not guarantee higher real yields, but as Gerard noted last week “some tightening of overall financial conditions, led by higher yields or lower risk asset prices, would probably be judged appropriate.”
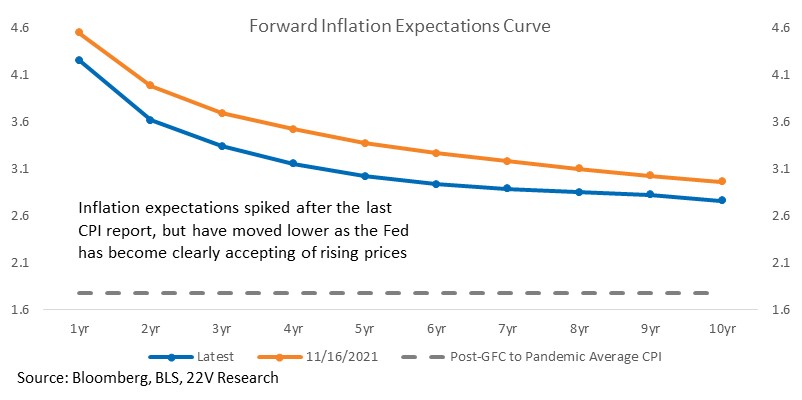
To position for a shifting real rates backdrop, we constructed a portfolio of the S&P stocks with the highest correlations to changes in real yields. So far, the index, on a long-short basis (long top correlated names and short bottom correlated names), has closely followed changes in implied real yields. Recently, the long end has outperformed the short, suggesting investors are starting to either position for higher real yields or, at least, are shying away from the stocks most levered to falling real yields.
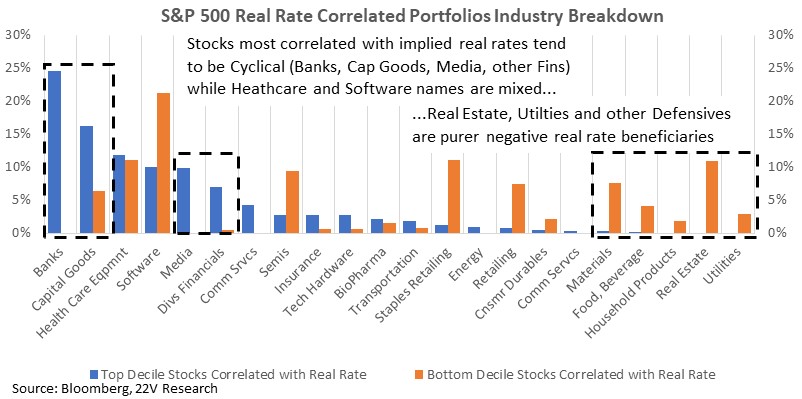
The long end of the real yields portfolio is messy from an industry group standpoint. Groups like Software and Healthcare Equipment tend to have names that are highly positively and highly negatively correlated to changes in real yields. In general though, more Cyclical groups (Banks, Cap Goods) have more consistent positive real yield correlations while more Defensive groups (Utilities, Real Estate) have more negative relationships.
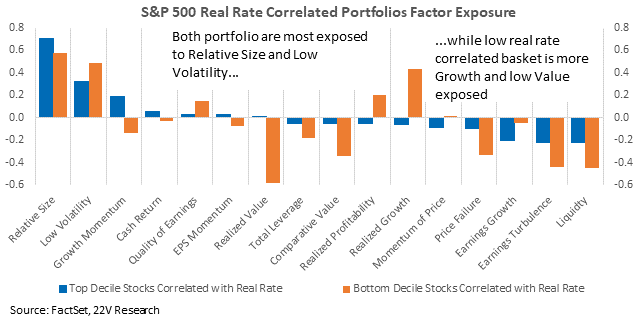
Both portfolios tend to be tilted toward larger, lower volatility names within the large cap index Both baskets are also tilted away from the high Earnings Turbulence names that are likely to struggle in the higher volatility environment brought on by the shift toward central bank tightening. Micro themes continue to emerge as the driving force within markets, but both real rate portfolios tend to stress the lower vol, lower uncertainty factor mix that should perform well as volatility trends higher.
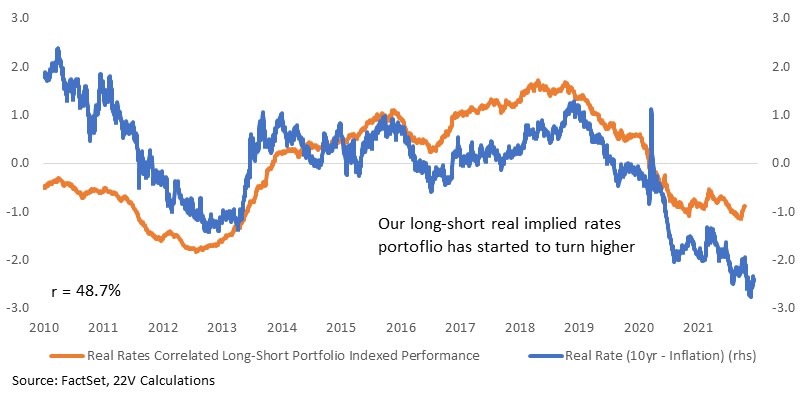
Regardless of your view on real yields moving forward, their importance as a macro force is likely to be increase over the coming quarters as monetary policy makers again try to move off the zero lower bound. In the table below we list the S&P stocks with the highest correlations to changes in implied real rates. These are names that should benefit most from an upward trend in real yields.
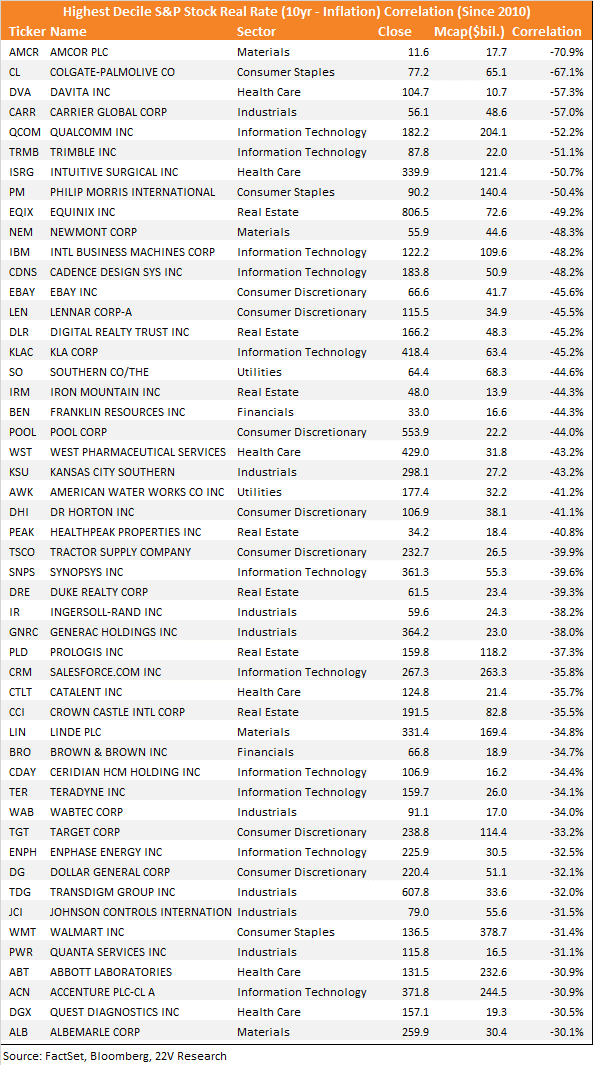
Below are the S&P stocks most negatively correlated to real yields.