Chart Spotlight – Fluor (FLR)
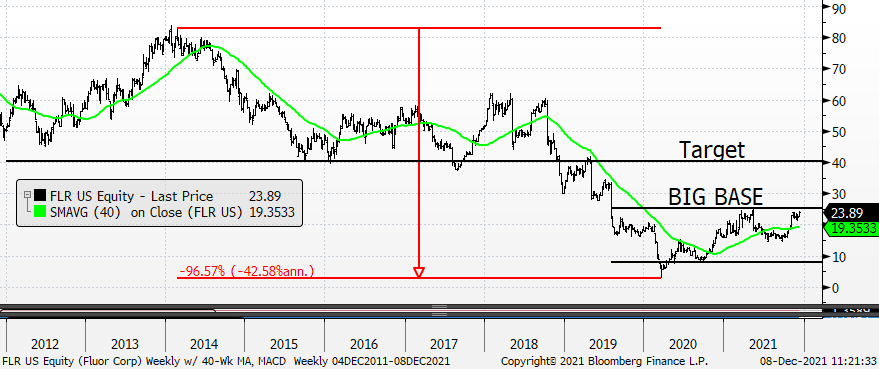
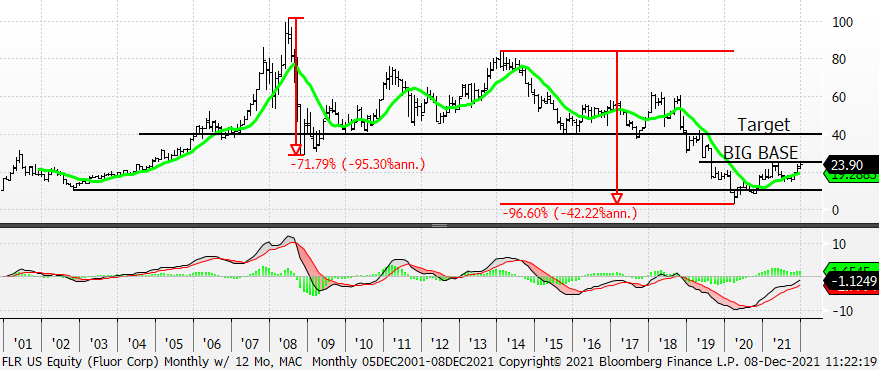
You’d be hard-pressed to find a stock less loved than Fluor – 1 Buy rating, 9 Holds and 0 Sells. And it makes sense, right? While there once was a time when Fluor was an absolute performance juggernaut – from Oct ’02 – summer ’08, the stock went from 10 – one hundred while over the same time the S&P was up 66% –, since the stock’s peak in 2008 it’s been a disaster as evidenced by the 97% cliff dive from its Jan ’14 peak – Mar ’20 low.
But since its COVID low, the stock has been able to stage three rallies (+434%, +206%, and +69%) with two intervening pullbacks that created higher lows. Too, FLR’s been BASING for the last 7-months but we might say that it’s BASED since August 2019 with the top end of its range at 25 and we’ll go with 8 as the bottom of that range.
The weekly chart below shows the stock is above its upward-sloping 40-week moving average with its BASE well-defined. While FLR still needs to break out above 25 to complete its BASE we’re comfortable giving it the benefit of the doubt here. The monthly chart at bottom provides a complete look at the stock’s price history back to 2001. It might be overly aggressive, but a breakout above 25 would imply a move to 40.