Sector Spotlight – Global Miners
It’s safe to say that if you monitor one metals / mining index you are monitoring them all. However, since charts are our life, we pay attention to all three.
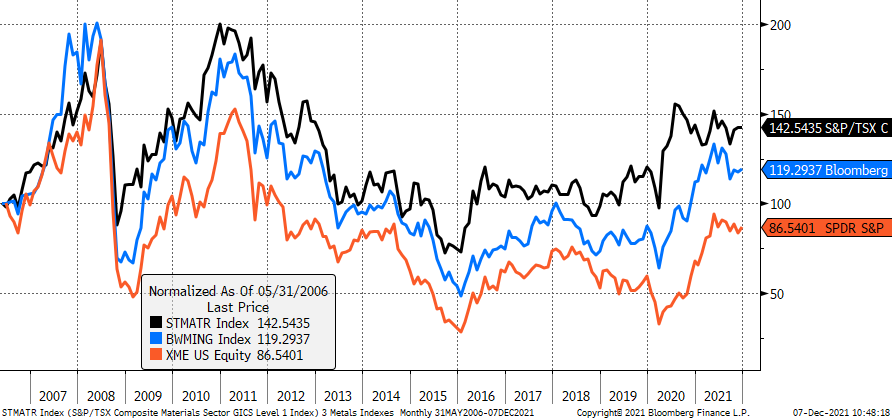
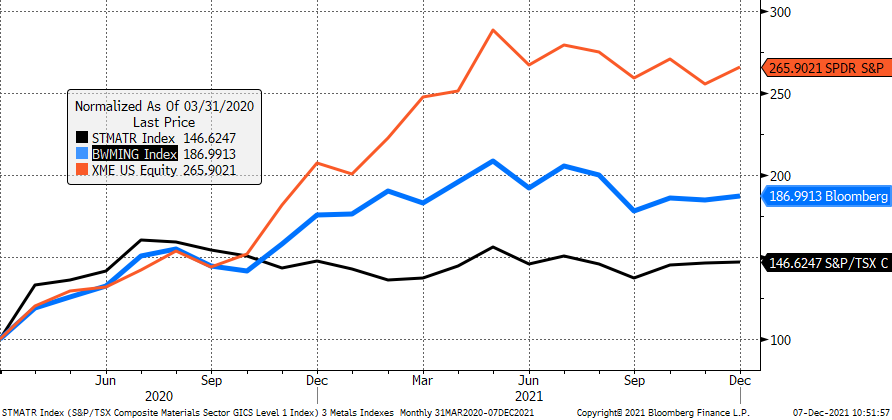
Monthly Chart for S&P / TSX Materials Index, Bloomberg World Miners Index, and SPDR S&P Metals & Mining ETF: The first chart shows them indexed to 100 as of May 31, 2006, and it’s easy to see that their performance has been a slog. Over 15 ½ years the S&P / TSX Materials Index is up 42 ½%, Bloomberg World Miners Index +19%, and the XME is down 13 ½%. However, since the COVID low the XME is up 166%, Bloomberg World Miners +87%, and the S&P / TSX Materials +47%. Consolidations first begun in spring 2021 continue. (2nd chart)
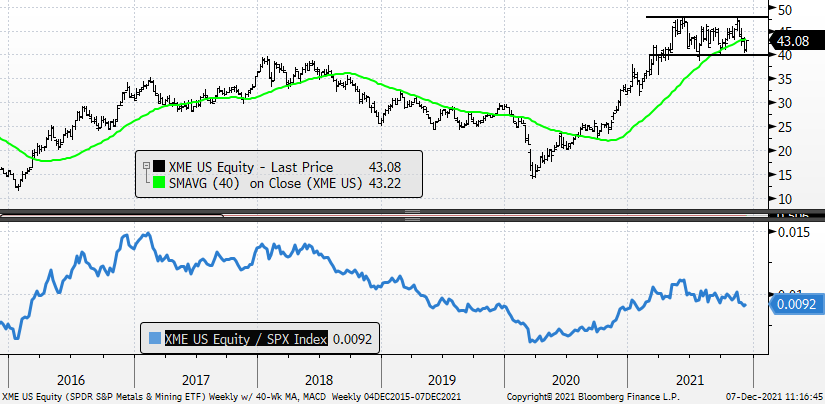
Weekly Chart for XME with XME Relative to the S&P: The XME has been consolidating since spring 2020 when its relative outperformance run vs. the S&P 500 peaked (lower panel). This ETF, plus the other two indexes, won’t get any credit until a breakout above spring 2020 highs occurs. Too, even if that happens it won’t likely get noticed unless the breakout is accompanied by a similar breakout for relative performance vs. the S&P.
We’ve been talking about these stocks – and commodities in general – for the last year and have heard many reasons for not buying them (i.e., too small in the index, over the long-term they can’t beat tech, the Fed won’t let inflation run that hot, “no analysts in my shop are covering them,” “I’d rather buy a chip shortage thesis than a ‘potential’ commodity thesis”, “I already have exposure to the group, I won FCX,” etc.) so we believe it’s safe to say that the group is not – in any way – owned broadly. Further, many are precluded from owning them owing to ESG restrictions (aren’t ESG restrictions just a euphemism for owning tech / more tech?).
Our take is that with rates up, inflation high, and a commodity bull market if these stocks are not being bought now — when will they be bought?
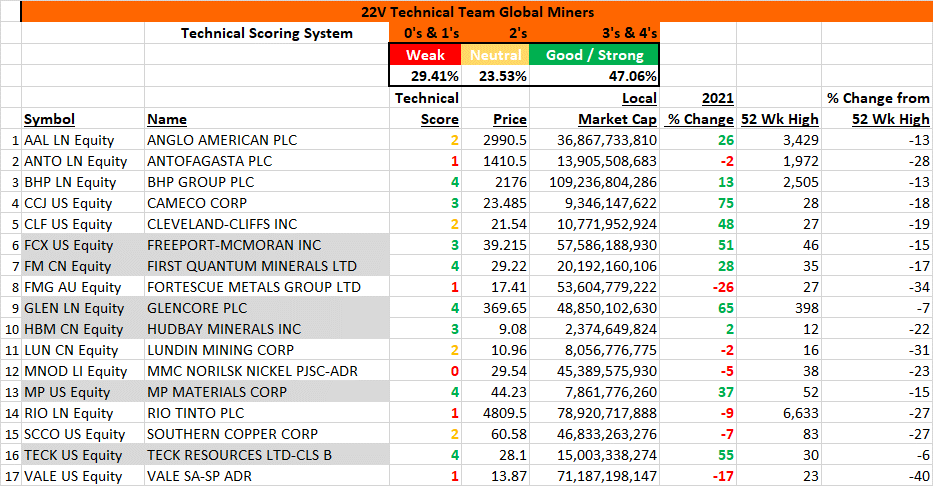
22V Technical Scoring System Global Miners – Stocks shaded gray are buys here.
Weekly chart Freeport-McMoRan w/ 40-Wk MA, weekly MACD, and Rel. to S&P
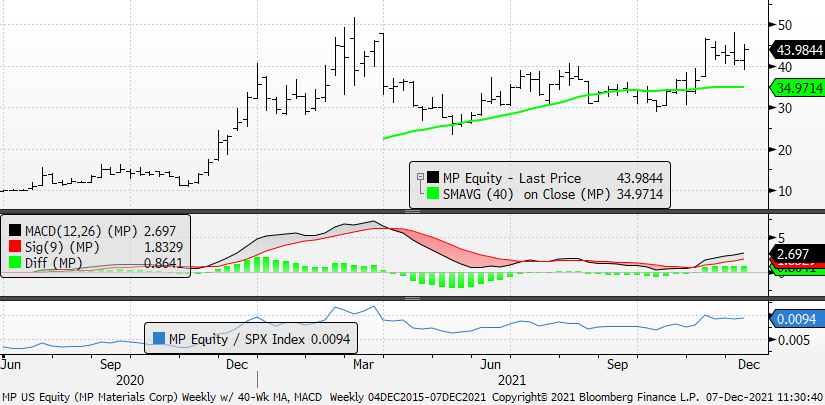
Weekly chart MP Materials w/ 40-Wk MA, weekly MACD, and Rel. to S&P