Sector Spotlight – Utilities
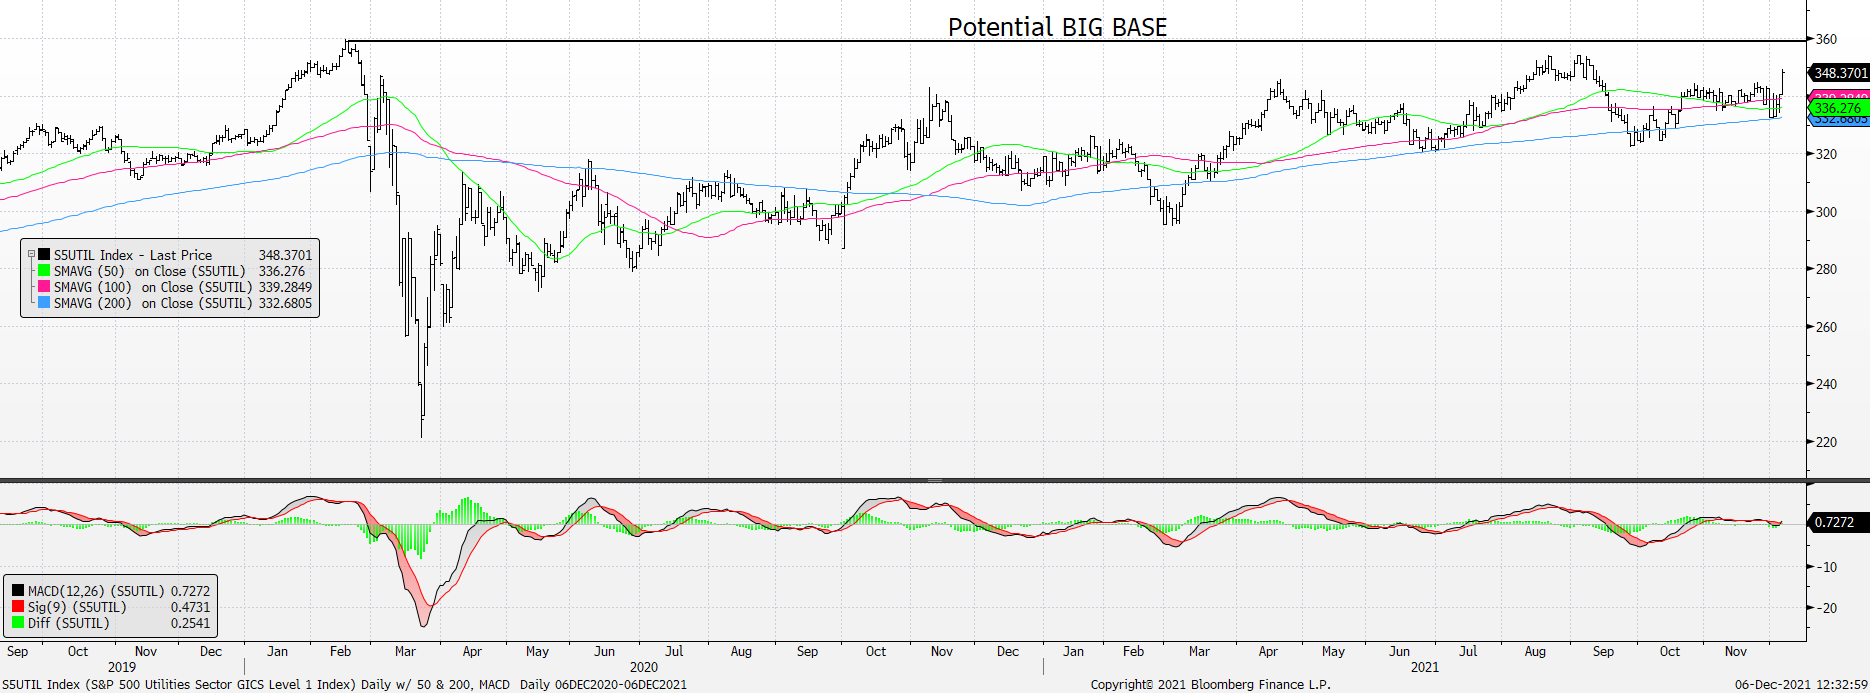
Daily Chart for S&P Utilities Sector with 50, 100, and 200-day moving averages and Daily MACD in the lower panel: While momentum is not dynamic, we’re partial to BIG BASES and this one is on our radar.
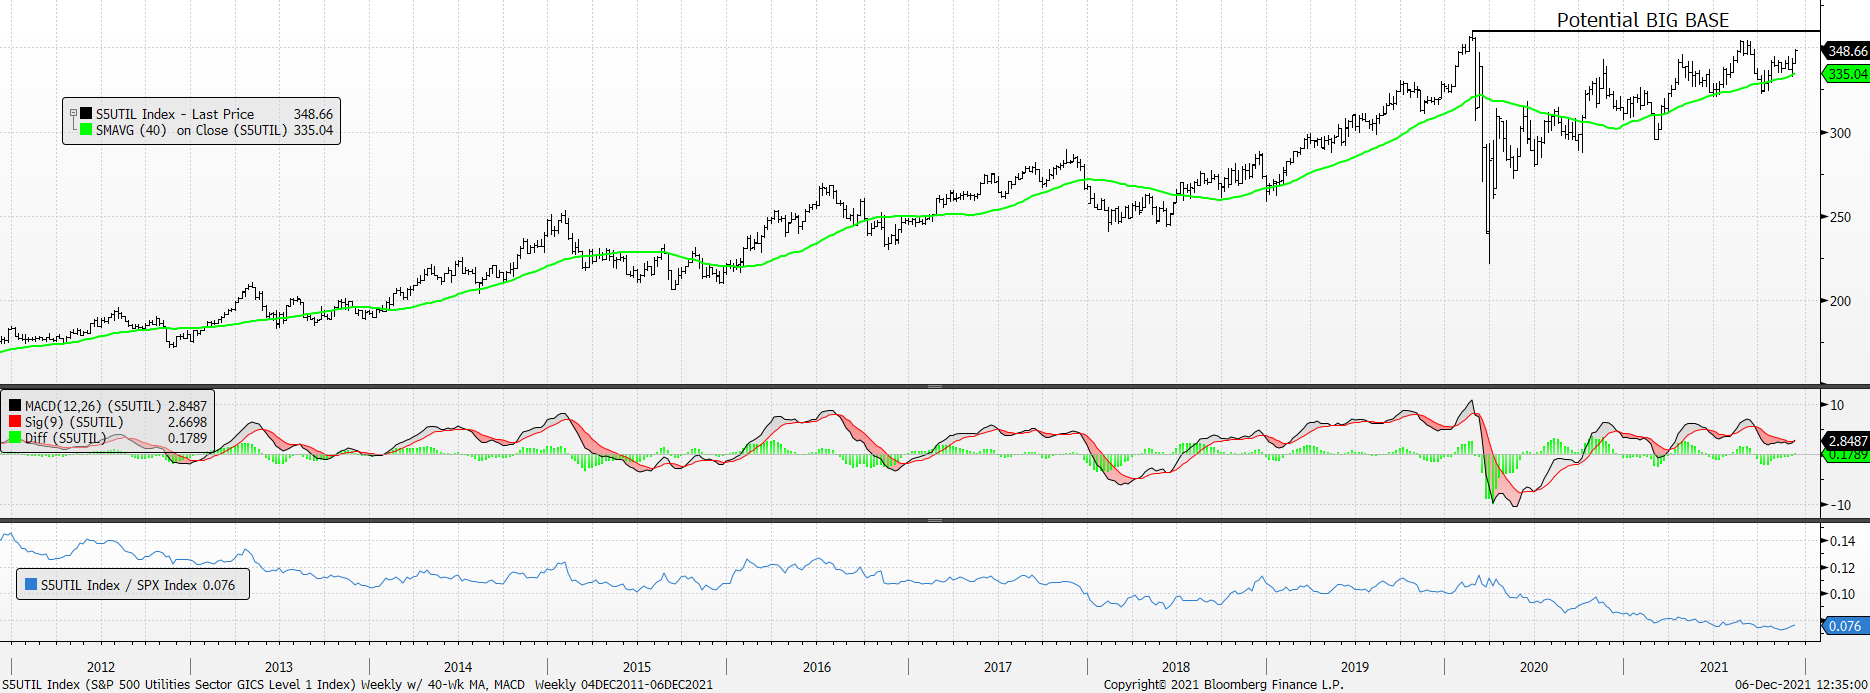
Weekly Chart for S&P Utilities Sector with 40-week moving average, Weekly MACD in the lower panel, and Rel to S&P in the bottom panel: Weekly momentum isn’t particularly impressive, either, but it is in positive territory. Also, the bottom panel showing S5UTIL / S&P is showing some semblance of a bottom / low.
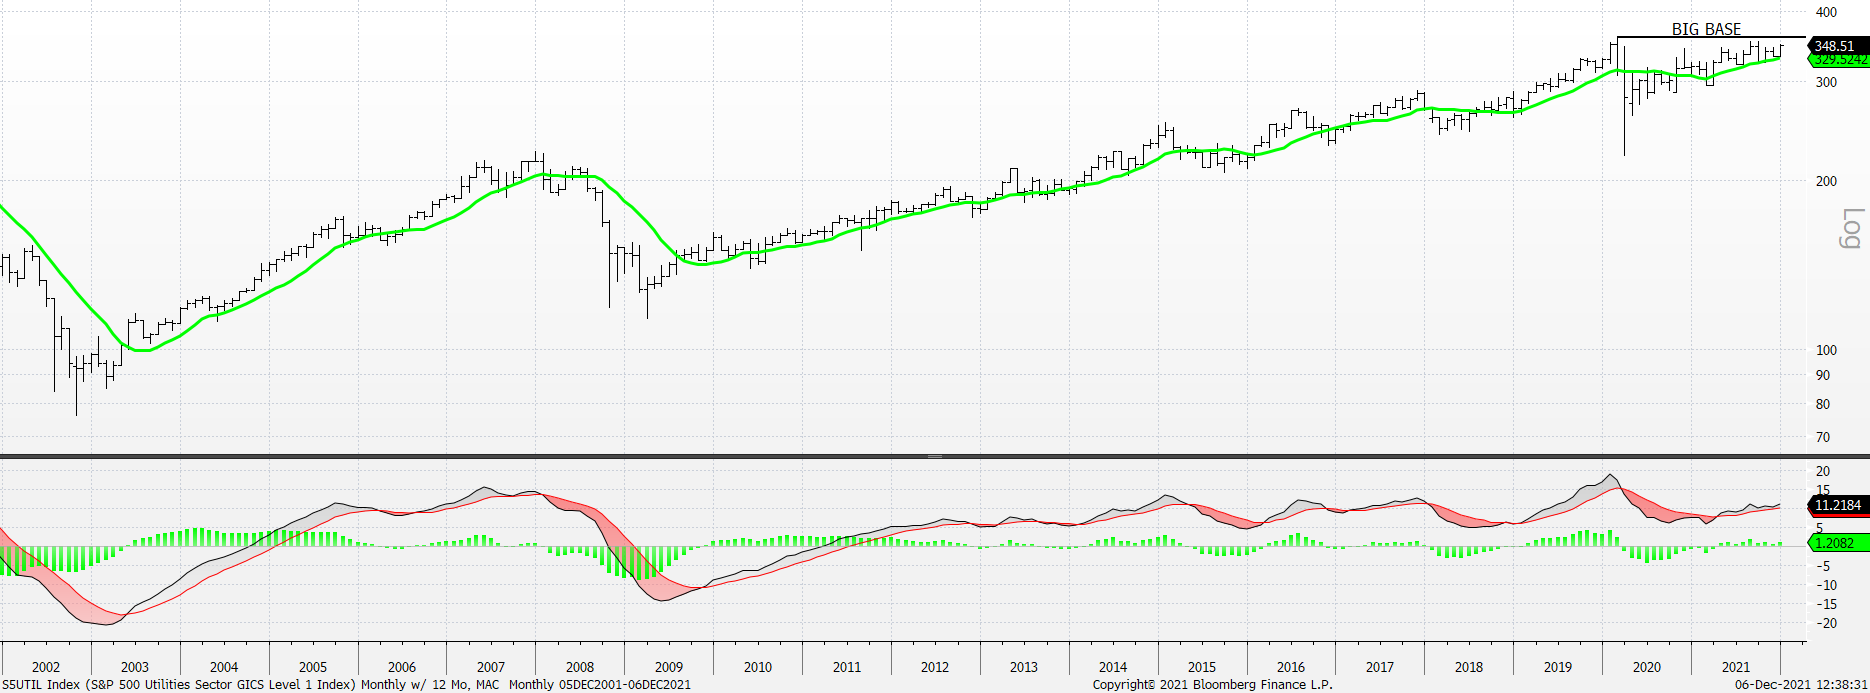
Monthly Chart for S&P Utilities Sector with 12-month moving average and Monthly MACD in the lower panel: The BIG BASE is clear here, too, and Monthly momentum is encouraging.
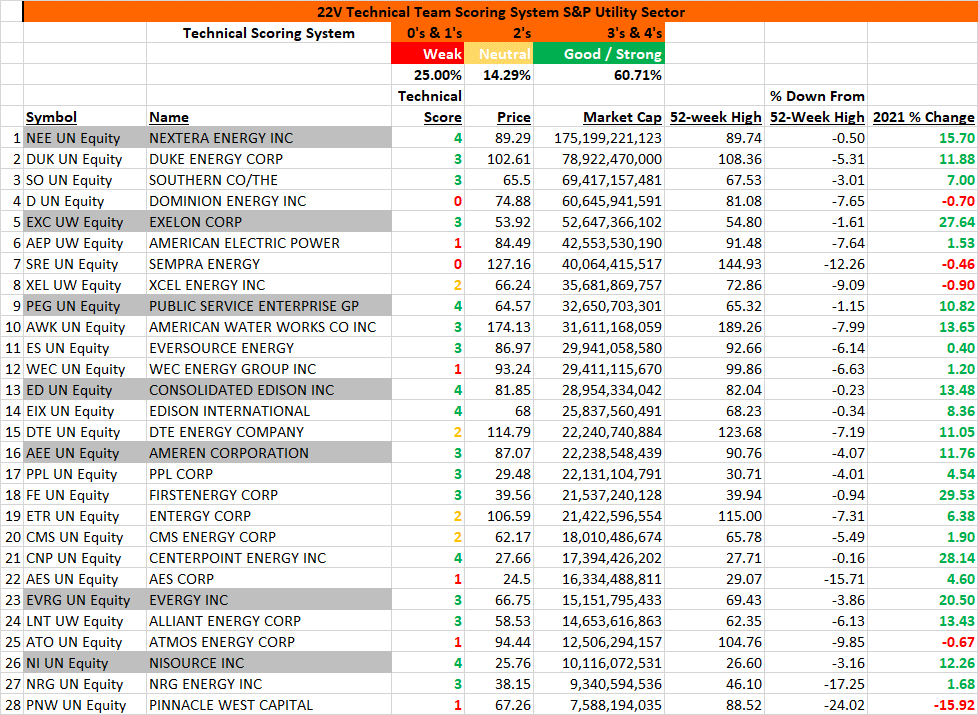
Our Technical Scoring System shows a healthy 61% with good / strong scores. The stocks shaded in gray are the ones we’d focus on here if you’re looking to add or initiate positions.