
Our entire repository of COVID charts is HERE.
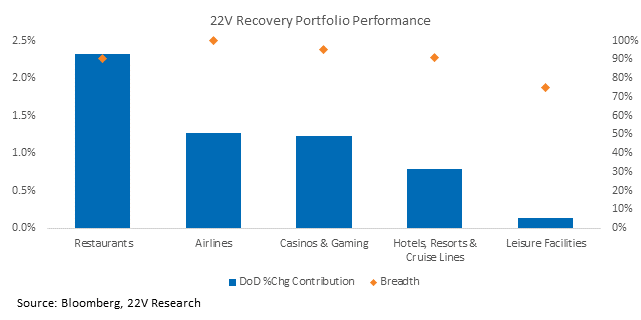
Investors are embracing positive (even if early) news about omicron. Equities have rallied today, our Recovery Portfolio is up +5.75%, and credit spreads are tighter. Dr. Fauci thinks initial data from South Africa is “a bit encouraging regarding the severity.” At the same time, he cautioned that it’s too early to be definitive. The Steve Biko and Tshwane District Hospital Complex in Pretoria, South Africa, said that, unlike in pervious waves, most patients in the Covid wards didn’t require oxygen. The same hospital network reported 29 of the 42 earliest hospitalizations were incidental cases – patients were not in the hospital for covid but tested positive for omicron because all patients in hospitals are tested. It’s a small sample size but suggests a portion of the covid-related hospitalizations aren’t covid-induced hospitalizations. We have heard concerns about hospitalizations because case growth is primarily in younger people, but the incidental rate does not imply children are being hospitalized because of covid at an alarming rate. John Burn-Murdoch has been updating a very useful graphic about case growth and hospitalizations, highlighting that case growth is outpacing earlier waves but hospitalizations are not. And, fyi, our friend Noah Smith posted his second omicron update, which we have found helpful.
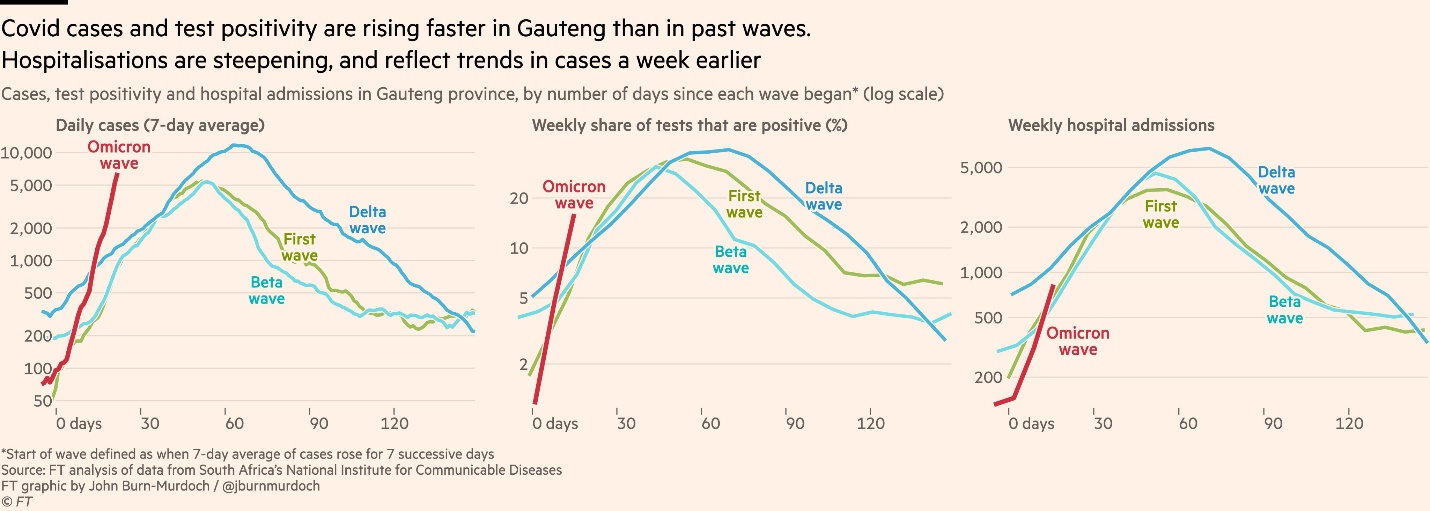
Levels are also important, and this wave has started from very low levels of infections and hospitalizations.

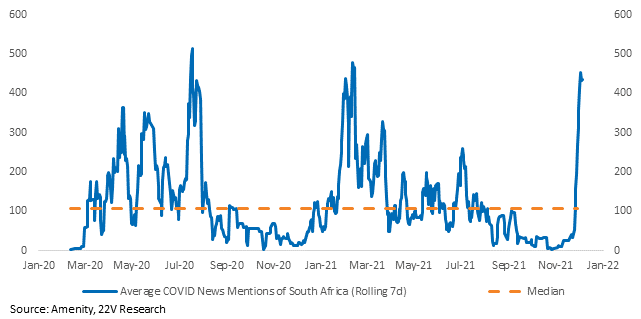
It’s important to assess the data we are all relying on. The attention people are paying to South Africa’s covid outbreak has skyrocketed. But the data that is being extrapolated to the rest of the world is from a province in South Africa that accounts for ~26% of the population of South Africa (and ~0.2% of the global population). And South Africa is not necessarily representative of the global picture. South Africa’s human development index (an admittedly imperfect metric) ranks 115th globally. Life expectancy is 15 years below the U.S. The point is that what is happening in South Africa is not necessarily the fashion in which omicron will play out elsewhere, like in Europe and the U.S.
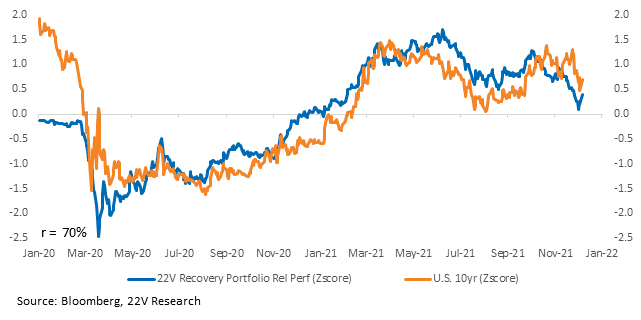
We still don’t know about vaccine efficacy. Moderna President Stephen Hoge said there’s a clear risk that existing vaccines will be less effective against omicron, though it’s too early to say by how much. Other vaccine developers last week expressed optimism that the shots will protect against severe illness. Investors we talk to expect efficacy to be very low (~50-65%). Higher than that is a tailwind for reopening stocks and even more so for 10yr yields, which are used as a left-tail hedge. If efficacy is much higher than 60%, big omicron case growth numbers will have less of an impact on risk assets. That noted, if case growth numbers remain large, there is still political and hospitalization risk (out of sheer volume) that will have an impact on risk assets shorter-term.
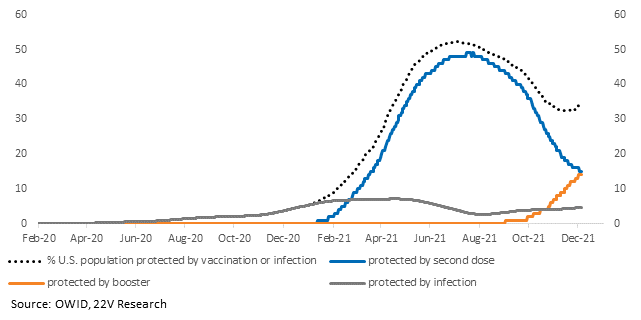
Omicron has been confirmed in 16 states. More people in the U.S. are vulnerable to infection now than before the Delta wave. Only 15% of the population have had their second dose in the last 6 months (after which efficacy wanes). 13% have had a booster. 5% have been infected in the last 6 months. That’s a total “protected” of 33%, much lower than 52% in July. This exercise (charted below) is NOT meant to reflect an exact number of those vulnerable to COVID. That would be false precision. This assumes no vaccine efficacy after 6 months, 100% efficacy before 6 months is up, and no reinfection risk within 6 months. We know these are unrealistic assumptions; the point is instead to compare this rough estimate to earlier in the pandemic to show susceptibility to infection is higher now, which we can conclude without getting too precise. This is not a great sign for case growth, which reinforces the importance of tracking severity instead.
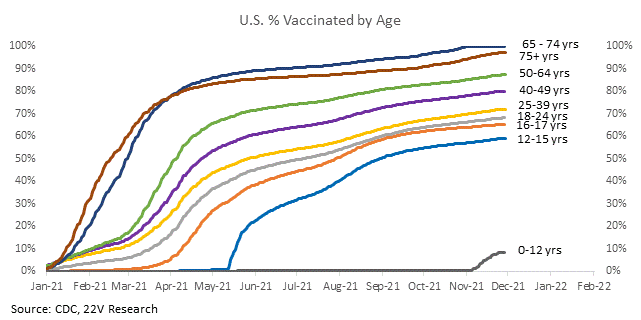
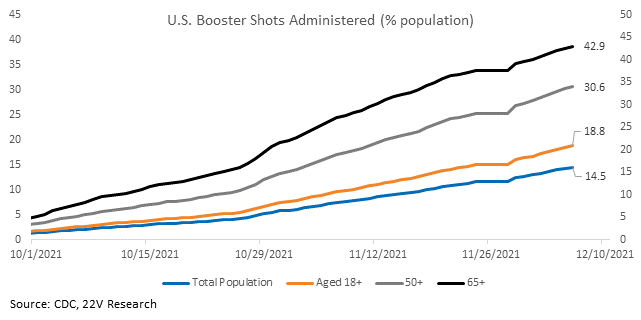
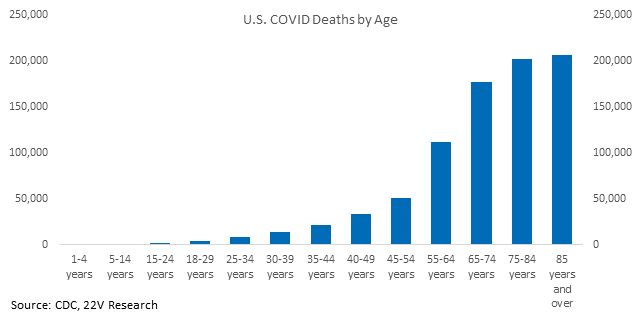
If vaccines provide at least some protection against severe cases of omicron, even as efficacy wanes, the U.S. is in decent shape to combat severe infections. ~60% of the population has been fully vaccinated, and coverage increases sequentially through each age cohort. Booster uptake is sequentially higher through age cohorts as well. This is important because deaths are concentrated in older cohorts. Boosters continue to be rolled out. We don’t know efficacy against omicron but, again, if vaccines provide some protection against severe cases then the economic impact is unlikely to be significant. The White House is announcing a nationwide campaign to get people their booster shots by expanding availability in pharmacies and implementing a system of reminders. Experts on vaccines and treatments have mixed opinions. Most recently, Moderna may know within 10 days how effective its shot is against omicron. BioNTech said modifying its covid jab may be required to boost immunity against the variant.
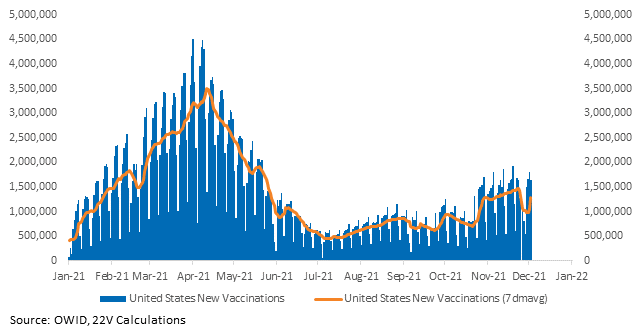
Investors have to contend with policy responses, which can affect market internals. President Biden relayed his belief that current measures are sufficient to deal with the new variant during his press conference after today’s jobs report. The WH is not currently weighing domestic travel limits. 22V’s Washington Policy team believes that if case growth is rapid but hospitalizations are not approaching capacity, then the odds of restrictions are low.
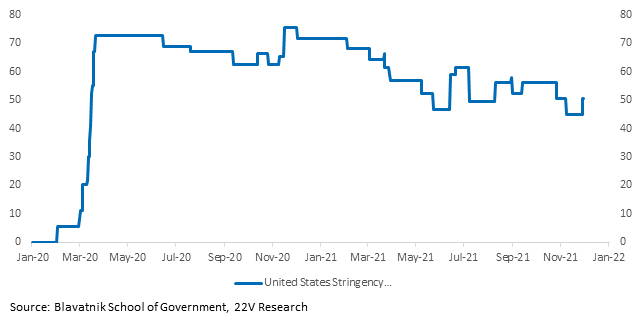
Investors have to contend with policy responses globally too though. Travel restrictions are being imposed globally. Restrictions are being imposed (especially in Europe) with varying degrees of severity. Oxford’s stringency indices will help objectively score how intense restrictions are. Restrictions are rising in Europe and are stable in the U.S. and Asia.
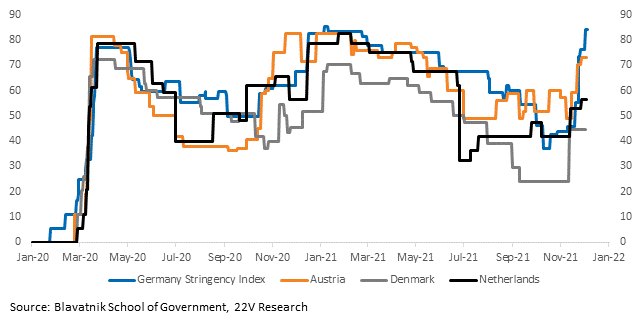
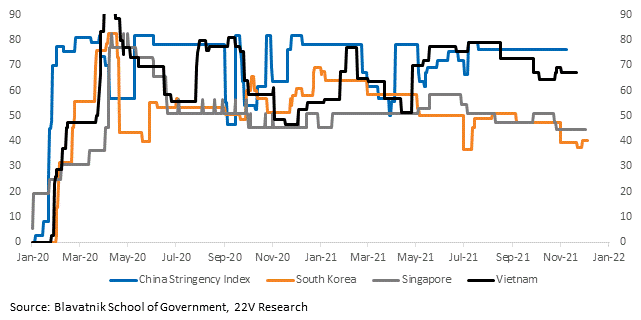
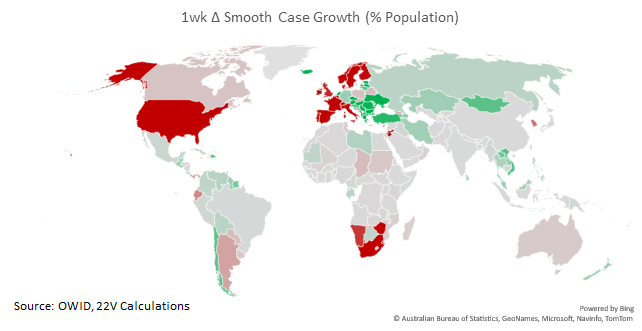
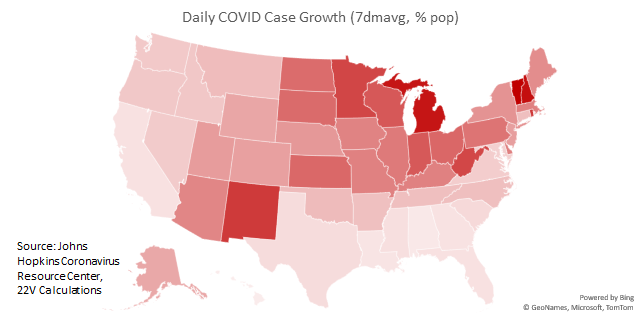
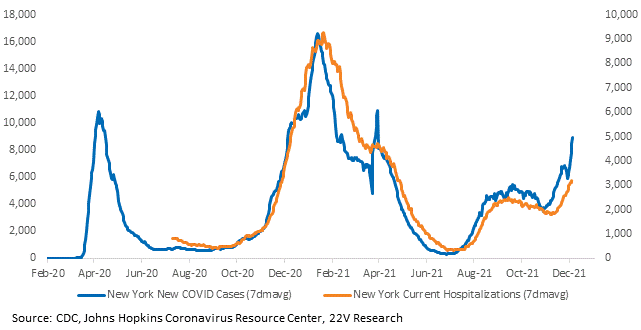
Case growth is worst in North America, Europe, and Africa. France is closing nightclubs for four weeks. In the U.S., case growth is worst in parts of the Southwest, Midwest, and Northeast. And effective December 27, NYC will require all private sector workers to be fully vaccinated.
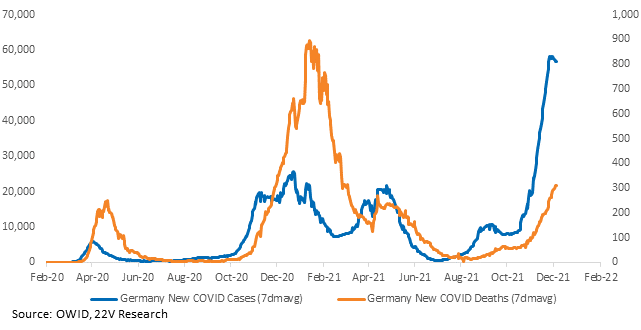
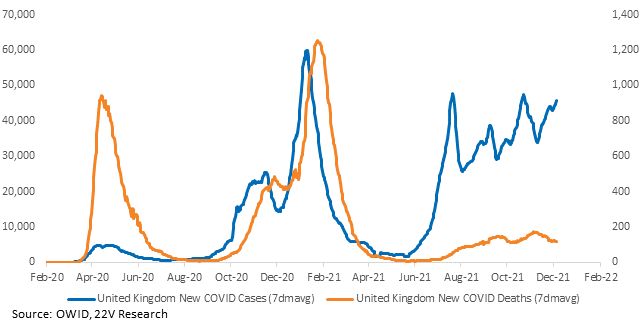
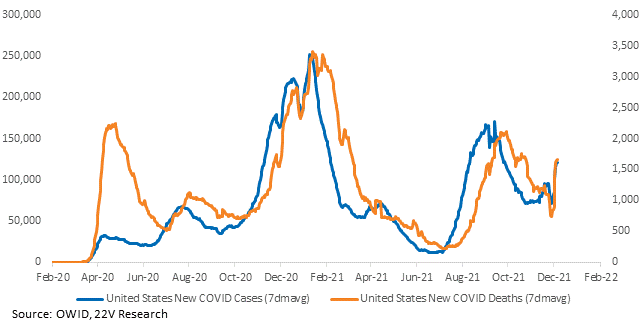
Charts of every state and country we have data for are HERE.


